Opening Range Breakout with Multi-Timeframe Liquidity]═══════════════════════════════════════
OPENING RANGE BREAKOUT WITH MULTI-TIMEFRAME LIQUIDITY
═══════════════════════════════════════
A professional Opening Range Breakout (ORB) indicator enhanced with multi-timeframe liquidity detection, trading session visualization, volume analysis, and trend confirmation tools. Designed for intraday trading with comprehensive alert system.
───────────────────────────────────────
WHAT THIS INDICATOR DOES
───────────────────────────────────────
This indicator combines multiple trading concepts:
- Opening Range Breakout (ORB) - Customizable time period detection with automatic high/low identification
- Multi-Timeframe Liquidity - HTF (Higher Timeframe) and LTF (Lower Timeframe) key level detection
- Trading Sessions - Tokyo, London, New York, and Sydney session visualization
- Volume Analysis - Volume spike detection and strength measurement
- Multi-Timeframe Confirmation - Trend bias from higher timeframes
- EMA Integration - Trend filter and dynamic support/resistance
- Smart Alerts - Quality-filtered breakout notifications
───────────────────────────────────────
HOW IT WORKS
───────────────────────────────────────
OPENING RANGE BREAKOUT (ORB):
Concept:
The Opening Range is a period at the start of a trading session where price establishes an initial high and low. Breakouts beyond this range often indicate the direction of the day's trend.
Detection Method:
- Default: 15-minute opening range (configurable)
- Custom Range: Set specific session times with timezone support
- Automatically identifies ORH (Opening Range High) and ORL (Opening Range Low)
- Tracks ORB mid-point for reference
Range Establishment:
1. Session starts (or custom time begins)
2. Tracks highest high and lowest low during the period
3. Range confirmed at end of opening period
4. Levels extend throughout the session
Breakout Detection:
- Bullish Breakout: Close above ORH
- Bearish Breakout: Close below ORL
- Mid-point acts as bias indicator
Visual Display:
- Shaded box during range formation
- Horizontal lines for ORH, ORL, and mid-point
- Labels showing level values
- Color-coded fills based on selected method
Fill Color Methods:
1. Session Comparison:
- Green: Current OR mid > Previous OR mid
- Red: Current OR mid < Previous OR mid
- Gray: Equal or first session
- Shows day-over-day momentum
2. Breakout Direction (Recommended):
- Green: Price currently above ORH (bullish breakout)
- Red: Price currently below ORL (bearish breakout)
- Gray: Price inside range (no breakout)
- Real-time breakout status
MULTI-TIMEFRAME LIQUIDITY:
Two-Tier System for comprehensive level identification:
HTF (Higher Timeframe) Key Liquidity:
- Default: 4H timeframe (configurable to Daily, Weekly)
- Identifies major institutional levels
- Uses pivot detection with adjustable parameters
- Suitable for swing highs/lows where large orders rest
LTF (Lower Timeframe) Key Liquidity:
- Default: 1H timeframe (configurable)
- Provides precision entry/exit levels
- Finer granularity for intraday trading
- Captures minor swing points
Calculation Method:
- Pivot high/low detection algorithm
- Configurable left bars (lookback) and right bars (confirmation)
- Timeframe multiplier for accurate multi-timeframe detection
- Automatic level extension
Mitigation System:
- Tracks when levels are swept (broken)
- Configurable mitigation type: Wick or Close-based
- Option to remove or show mitigated levels
- Display limit prevents chart clutter
Asset-Specific Optimization:
The indicator includes quick reference settings for different assets:
- Major Forex (EUR/USD, GBP/USD): Default settings optimal
- Crypto (BTC/ETH): Left=12, Right=4, Display=7
- Gold: HTF=1D, Left=20
TRADING SESSIONS:
Four Major Sessions with Full Customization:
Tokyo Session:
- Default: 04:00-13:00 UTC+4
- Asian trading hours
- Often sets daily range
London Session:
- Default: 11:00-20:00 UTC+4
- Highest liquidity period
- Major institutional activity
New York Session:
- Default: 16:00-01:00 UTC+4
- US market hours
- High-impact news events
Sydney Session:
- Default: 01:00-10:00 UTC+4
- Earliest Asian activity
- Lower volatility
Session Features:
- Shaded background boxes
- Session name labels
- Optional open/close lines
- Session high/low tracking with colored lines
- Each session has independent color settings
- Fully customizable times and timezones
VOLUME ANALYSIS:
Volume-Based Trade Confirmation:
Volume MA:
- Configurable period (default: 20)
- Establishes average volume baseline
- Used for spike detection
Volume Spike Detection:
- Identifies when volume exceeds MA * multiplier
- Default: 1.5x average volume
- Confirms breakout strength
Volume Strength Measurement:
- Calculates current volume as percentage of average
- Shows relative volume intensity
- Used in alert quality filtering
High Volume Bars:
- Identifies bars above 50th percentile
- Additional confirmation layer
- Indicates institutional participation
MULTI-TIMEFRAME CONFIRMATION:
Trend Bias from Higher Timeframes:
HTF 1 (Trend):
- Default: 1H timeframe
- Uses EMA to determine intermediate trend
- Compares current timeframe EMA to HTF EMA
HTF 2 (Bias):
- Default: 4H timeframe
- Uses 50 EMA for longer-term bias
- Confirms overall market direction
Bias Classifications:
- Bullish Bias: HTF close > HTF 50 EMA AND Current EMA > HTF1 EMA
- Bearish Bias: HTF close < HTF 50 EMA AND Current EMA < HTF1 EMA
- Neutral Bias: Mixed signals between timeframes
EMA Stack Analysis:
- Compares EMA alignment across timeframes
- +1: Bullish stack (lower TF EMA > higher TF EMA)
- -1: Bearish stack (lower TF EMA < higher TF EMA)
- 0: Neutral/crossed
Usage:
- Filters false breakouts
- Confirms trend direction
- Improves trade quality
EMA INTEGRATION:
Dynamic EMA for Trend Reference:
Features:
- Configurable period (default: 20)
- Customizable color and width
- Acts as dynamic support/resistance
- Trend filter for ORB trades
Application:
- Above EMA: Favor long breakouts
- Below EMA: Favor short breakouts
- EMA cross: Potential trend change
- Distance from EMA: Momentum gauge
SMART ALERT SYSTEM:
Quality-Filtered Breakout Notifications:
Alert Types:
1. Standard ORB Breakout
2. High Quality ORB Breakout
Quality Criteria:
- Volume Confirmation: Volume > 1.2x average
- MTF Confirmation: Bias aligned with breakout direction
Standard Alert:
- Basic breakout detection
- Price crosses ORH or ORL
- Icon: 🚀 (bullish) or 🔻 (bearish)
High Quality Alert:
- Both volume AND MTF confirmed
- Stronger probability setup
- Icon: 🚀⭐ (bullish) or 🔻⭐ (bearish)
Alert Information Includes:
- Alert quality rating
- Breakout level and current price
- Volume strength percentage (if enabled)
- MTF bias status (if enabled)
- Recommended action
One Alert Per Bar:
- Prevents alert spam
- Uses flag system to track sent alerts
- Resets on new ORB session
───────────────────────────────────────
HOW TO USE
───────────────────────────────────────
OPENING RANGE SETUP:
Basic Configuration:
1. Select time period for opening range (default: 15 minutes)
2. Choose fill color method (Breakout Direction recommended)
3. Enable historical data display if needed
Custom Range (Advanced):
1. Enable Custom Range toggle
2. Set specific session time (e.g., 0930-0945)
3. Select appropriate timezone
4. Useful for specific market opens (NYSE, LSE, etc.)
LIQUIDITY LEVELS SETUP:
Quick Configuration by Asset:
- Forex: Use default settings (Left=15, Right=5)
- Crypto: Set Left=12, Right=4, Display=7
- Gold: Set HTF=1D, Left=20
HTF Liquidity:
- Purpose: Major support/resistance levels
- Recommended: 4H for day trading, 1D for swing trading
- Use as profit targets or reversal zones
LTF Liquidity:
- Purpose: Entry/exit refinement
- Recommended: 1H for day trading, 4H for swing trading
- Use for position management
Mitigation Settings:
- Wick-based: More sensitive (default)
- Close-based: More conservative
- Remove or Show mitigated levels based on preference
TRADING SESSIONS SETUP:
Enable/Disable Sessions:
- Master toggle for all sessions
- Individual session controls
- Show/hide session names
Session High/Low Lines:
- Enable to see session extremes
- Each session has custom colors
- Useful for range trading
Customization:
- Adjust session times for your broker
- Set timezone to match your location
- Customize colors for visibility
VOLUME ANALYSIS SETUP:
Enable Volume Analysis:
1. Toggle on Volume Analysis
2. Set MA length (20 recommended)
3. Adjust spike multiplier (1.5 typical)
Usage:
- Confirm breakouts with volume
- Identify climactic moves
- Filter false signals
MULTI-TIMEFRAME SETUP:
HTF Selection:
- HTF 1 (Trend): 1H for day trading, 4H for swing
- HTF 2 (Bias): 4H for day trading, 1D for swing
Interpretation:
- Trade only with bias alignment
- Neutral bias: Be cautious
- Bias changes: Potential reversals
EMA SETUP:
Configuration:
- Period: 20 for responsive, 50 for smoother
- Color: Choose contrasting color
- Width: 1-2 for visibility
Usage:
- Filter trades: Long above, Short below
- Dynamic support/resistance reference
- Trend confirmation
ALERT SETUP:
TradingView Alert Creation:
1. Enable alerts in indicator settings
2. Enable ORB Breakout Alerts
3. Right-click chart → Add Alert
4. Select this indicator
5. Choose "Any alert() function call"
6. Configure delivery method (mobile, email, webhook)
Alert Filtering:
- All alerts include quality rating
- High Quality alerts = Volume + MTF confirmed
- Standard alerts = Basic breakout only
───────────────────────────────────────
TRADING STRATEGIES
───────────────────────────────────────
CLASSIC ORB STRATEGY:
Setup:
1. Wait for opening range to complete
2. Price breaks and closes above ORH or below ORL
3. Volume > average (if enabled)
4. MTF bias aligned (if enabled)
Entry:
- Bullish: Buy on break above ORH
- Bearish: Sell on break below ORL
- Consider retest entries for better risk/reward
Stop Loss:
- Bullish: Below ORL or range mid-point
- Bearish: Above ORH or range mid-point
- Adjust based on volatility
Targets:
- Initial: Range width extension (ORH + range width)
- Secondary: HTF liquidity levels
- Final: Session high/low or major support/resistance
ORB + LIQUIDITY CONFLUENCE:
Enhanced Setup:
1. Opening range established
2. HTF liquidity level near or beyond ORH/ORL
3. Breakout occurs with volume
4. Price targets the liquidity level
Entry:
- Enter on ORB breakout
- Target the HTF liquidity level
- Use LTF liquidity for position management
Management:
- Partial profits at ORB + range width
- Move stop to breakeven at LTF liquidity
- Final exit at HTF liquidity sweep
ORB REJECTION STRATEGY (Counter-Trend):
Setup:
1. Price breaks above ORH or below ORL
2. Weak volume (below average)
3. MTF bias opposite to breakout
4. Price closes back inside range
Entry:
- Failed bullish break: Short below ORH
- Failed bearish break: Long above ORL
Stop Loss:
- Beyond the failed breakout level
- Or beyond session extreme
Target:
- Opposite end of opening range
- Range mid-point for partial profit
SESSION-BASED ORB TRADING:
Tokyo Session:
- Typically narrower ranges
- Good for range trading
- Wait for London open breakout
London Session:
- Highest volume and volatility
- Strong ORB setups
- Major liquidity sweeps common
New York Session:
- Strong trending moves
- News-driven volatility
- Good for momentum trades
Sydney Session:
- Quieter conditions
- Suitable for range strategies
- Sets up Tokyo session
EMA-FILTERED ORB:
Rules:
- Only take bullish breaks if price > EMA
- Only take bearish breaks if price < EMA
- Ignore counter-trend breaks
Benefits:
- Reduces false signals
- Aligns with larger trend
- Improves win rate
───────────────────────────────────────
CONFIGURATION GUIDE
───────────────────────────────────────
OPENING RANGE SETTINGS:
Time Period:
- 15 min: Standard for most markets
- 30 min: Wider range, fewer breakouts
- 60 min: For slower markets or swing trades
Custom Range:
- Use for specific market opens
- NYSE: 0930-1000 EST
- LSE: 0800-0830 GMT
- Set timezone to match exchange
Historical Display:
- Enable: See all previous session data
- Disable: Cleaner chart, current session only
LIQUIDITY SETTINGS:
Left Bars (5-30):
- Lower: More frequent, sensitive levels
- Higher: Fewer, more significant levels
- Recommended: 15 for most markets
Right Bars (1-25):
- Confirmation period
- Higher: More reliable, less frequent
- Recommended: 5 for balance
Display Limit (1-20):
- Number of active levels shown
- Higher: More context, busier chart
- Recommended: 7 for clarity
Extension Options:
- Short: Levels visible near formation
- Current: Extended to current bar (recommended)
- Max: Extended indefinitely
VOLUME SETTINGS:
MA Length (5-50):
- Shorter: More responsive to spikes
- Longer: Smoother baseline
- Recommended: 20 for balance
Spike Multiplier (1.0-3.0):
- Lower: More sensitive spike detection
- Higher: Only extreme spikes
- Recommended: 1.5 for day trading
MULTI-TIMEFRAME SETTINGS:
HTF 1 (Trend):
- 5m chart: Use 15m or 1H
- 15m chart: Use 1H or 4H
- 1H chart: Use 4H or 1D
HTF 2 (Bias):
- One level higher than HTF 1
- Provides longer-term context
- Don't use same as HTF 1
EMA SETTINGS:
Length:
- 20: Responsive, more signals
- 50: Smoother, stronger filter
- 200: Long-term trend only
Style:
- Choose contrasting color
- Width 1-2 for visibility
- Match your trading style
───────────────────────────────────────
BEST PRACTICES
───────────────────────────────────────
Chart Timeframe Selection:
- ORB Trading: Use 5m or 15m charts
- Session Review: Use 1H or 4H charts
- Swing Trading: Use 1H or 4H charts
Quality Over Quantity:
- Wait for high-quality alerts (volume + MTF)
- Avoid trading every breakout
- Focus on confluence setups
Risk Management:
- Position size based on range width
- Wider ranges = smaller positions
- Use stop losses always
- Take partial profits at targets
Market Conditions:
- Best results in trending markets
- Reduce position size in choppy conditions
- Consider session overlaps for volatility
- Avoid trading near major news if inexperienced
Continuous Improvement:
- Track win rate by session
- Note which confluence factors work best
- Adjust settings based on market volatility
- Review performance weekly
───────────────────────────────────────
PERFORMANCE OPTIMIZATION
───────────────────────────────────────
This indicator is optimized with:
- max_bars_back declarations for efficient processing
- Conditional calculations based on enabled features
- Proper memory management for drawing objects
- Minimal recalculation on each bar
Best Practices:
- Disable unused features (sessions, MTF, volume)
- Limit historical display to reduce rendering
- Use appropriate timeframe for your strategy
- Clear old drawing objects periodically
───────────────────────────────────────
EDUCATIONAL DISCLAIMER
───────────────────────────────────────
This indicator combines established trading concepts:
- Opening Range Breakout theory (price action)
- Liquidity level detection (pivot analysis)
- Session-based trading (time-of-day patterns)
- Volume analysis (confirmation technique)
- Multi-timeframe analysis (trend alignment)
All calculations use standard technical analysis methods:
- Pivot high/low detection algorithms
- Moving averages for trend and volume
- Session time filtering
- Timeframe security functions
The indicator identifies potential trading setups but does not predict future price movements. Success requires proper application within a complete trading strategy including risk management, position sizing, and market context.
───────────────────────────────────────
USAGE DISCLAIMER
───────────────────────────────────────
This tool is for educational and analytical purposes. Opening Range Breakout trading involves substantial risk. The alert system and quality filters are designed to identify potential setups but do not guarantee profitability. Always conduct independent analysis, use proper risk management, and never risk capital you cannot afford to lose. Past performance does not indicate future results. Trading intraday breakouts requires experience and discipline.
───────────────────────────────────────
CREDITS & ATTRIBUTION
───────────────────────────────────────
ORIGINAL SOURCE:
This indicator builds upon concepts from LuxAlgo's-ORB
ค้นหาในสคริปต์สำหรับ "session high"

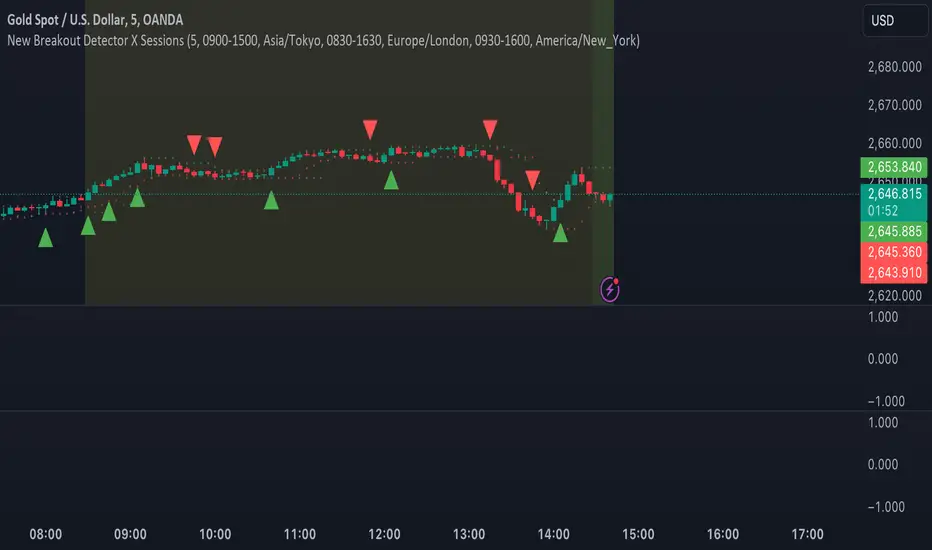
MJForex Breakout Detector X SessionsThis Pine Script code is a Breakout Detector with Trading Session highlights for use on a financial chart. Here's a detailed breakdown of its functionality:
1. Breakout Detection
The main purpose of this script is to detect breakouts based on specific price levels (like highs and lows) within a given lookback period. It identifies different types of breakouts in real time, specifically:
Higher High (HH): The highest price in the lookback period is exceeded, suggesting bullish momentum.
Higher Low (HL): A low that is higher than the previous low, which might indicate a potential upward trend continuation.
Lower High (LH): The price makes a lower high than the previous high, indicating a possible downward reversal.
Lower Low (LL): A low that is lower than the previous low, indicating bearish momentum.
Breakout Logic:
A buy signal is generated when there is a breakout above a Higher High or a Higher Low, signaling a potential bullish trend.
A sell signal is generated when there is a breakout below a Lower High or a Lower Low, signaling a potential bearish trend.
These signals are plotted on the chart using shapes (green triangles for buy signals and red triangles for sell signals).
2. Candle Body vs. Wick Consideration
The indicator allows you to choose whether the breakout is detected based on the candle body (the open and close prices) or the wick (the high and low prices).
This is controlled by a user input (use_body), so you can switch between these modes depending on your preference.
3. Trading Session Highlights
The script also visually highlights different trading sessions on the chart. Three sessions can be configured:
First Session (e.g., Asia/Tokyo)
Second Session (e.g., Europe/London)
Third Session (e.g., America/New York)
Each session is colored differently on the chart's background (blue, yellow, and green), helping you easily visualize which trading session is currently active.
4. Real-Time Alerts
The script generates real-time alerts when a breakout occurs.
Alerts are sent based on the current price action without waiting for the candle to close, which helps traders respond quickly to potential breakout signals and be aware of the particular zone or area.
Alerts:
A Buy alert is triggered when there's a Higher High (HH) or Higher Low (HL) breakout.
A Sell alert is triggered when there's a Lower High (LH) or Lower Low (LL) breakout.
These alerts can be used to notify traders when certain breakout conditions are met, allowing them to take action immediately.
5. Customizability
The script allows for several customizable inputs:
Lookback Period: The number of bars used to calculate the highest high and lowest low (default is 5).
Breakout Detection Toggle: You can choose whether to show the breakout signals on the chart.
Session Visibility: You can turn on/off the visual highlights for the trading sessions.
Body/Wick Toggle: You can select whether to consider the candle body or the wick when detecting breakouts.
In Summary:
Breakout Detection: Detects and highlights Higher High, Higher Low, Lower High, and Lower Low breakouts on the chart, generating buy/sell signals.
Candle Body/Wick Option: You can choose to detect breakouts based on the body or wick of the candle.
Real-Time Alerts: Sends alerts as soon as a breakout occurs, without waiting for the candle to close.
Trading Session Highlights: Highlights different global trading sessions for easy visual reference on the chart.
This indicator is particularly useful for traders who want to identify key breakouts and visually track trading sessions across different markets.
Essa's Indicator 2.0Essa's Indicator V2: Beginner's Guide
This custom TradingView indicator has been designed to help you identify key trading opportunities based on session highs/lows, volatility, and moving averages. Below is a breakdown of the main features:
1. Exponential Moving Averages (EMAs)
Fast EMA (Blue Line): Tracks the short-term market trend (default: 9-period EMA).
Slow EMA (Red Line): Tracks the longer-term market trend (default: 21-period EMA).
You can turn on/off the EMAs using the "Show EMAs" option in the settings.
EMAs help smooth out price action and give a clearer picture of trends. A crossover of the fast EMA above the slow EMA can signal an upward trend, while the reverse may indicate a downward trend.
2. Session Highs and Lows
The indicator tracks price highs and lows for three major trading sessions:
London Session (Red): Highlighted in red. Active between 08:00 and 17:00 (LDN timezone) or 03:00 and 12:00 (NY timezone).
New York Session (Blue): Highlighted in blue. Active between 12:00 and 21:00 (LDN timezone) or 07:00 and 16:00 (NY timezone).
Asia Session (Yellow): Highlighted in yellow. Active between 22:00 and 08:00 (LDN timezone) or 18:00 and 03:00 (NY timezone).
Highs and lows for each session are plotted on the chart as lines. Breakouts from these levels can signal important trading opportunities:
London High/Low: Red lines.
New York High/Low: Blue lines.
Asia High/Low: Yellow lines.
The background color also changes depending on the active session:
London: Light red background.
New York: Light blue background.
Asia: Light yellow background.
3. Breakout Alerts
You can set alerts when the price breaks above or below session highs/lows:
Break Above London High: Alert triggered when the price crosses the London session high.
Break Below London Low: Alert triggered when the price falls below the London session low.
Similar alerts exist for the New York and Asia sessions as well.
4. Volatility-Adjusted EMA
The EMAs in this indicator are adjusted based on volatility (ATR - Average True Range). This allows the EMAs to respond to market conditions more dynamically, giving you more accurate trend readings in volatile markets.
5. ZigZag Feature (Optional)
You can enable the ZigZag feature to help visualize the price action's highs and lows:
ZigZag Lines: Highlight major peaks and troughs in price movements, helping you spot trends more easily.
This is helpful for identifying reversals or trend continuations.
6. Fractal Markers
This indicator uses fractals to mark potential turning points in the market:
Green Triangles (Above the Price): Indicate up fractals (potential reversal points where the price could move upwards).
Red Triangles (Below the Price): Indicate down fractals (potential reversal points where the price could move downwards).
Fractals can be a helpful confirmation tool when identifying entry and exit points.
7. Custom Timezone Options
You can choose between London (LDN) and New York (NY) timezones in the settings to adapt the session times to your trading location. This ensures the session high/low markers are displayed correctly for your trading region.
By default, the New York (NY) timezone is enabled for FXCM charts in the UK.
For BTC charts, you will need to switch to the appropriate time zone manually.
Thanks
Essa

Liquidity Entry Triggers (4-Model System) | WarRoomXYZLiquidity Entry Triggers is an open-source, price-action-based analytical framework designed to highlight recurring institutional liquidity behaviors that appear across all liquid markets.
The script focuses on how and where liquidity is taken, rather than attempting to predict direction using oscillators or lagging indicators.
It is optimized for XAUUSD, FX pairs, indices, and crypto , particularly on 1m–15m timeframes where session behavior and liquidity reactions are most visible.
This tool is not a buy/sell signal generator .
It provides contextual entry zones based on structural liquidity logic, allowing traders to apply their own execution rules.
Core Philosophy
Markets move because of:
•Trapped traders
•Forced liquidations
•Session-based liquidity cycles
•Reactions at prior institutional participation zones
This script visualizes four repeatable entry triggers that emerge from those mechanisms.
🔹 1. Failed Breakout / Trapped Trader Model
When price breaks a clearly defined range high or low, breakout traders often enter expecting continuation.
If price fails to hold outside the range and closes back inside, those traders become trapped.
The script detects:
•Breaks beyond recent highs/lows
•Immediate rejection back into the range
•Structural failure of momentum
These conditions frequently lead to mean reversion or reversal moves as trapped traders exit and fuel movement in the opposite direction.
Markers are plotted at the point of failure to highlight potential trap zones.
🔹 2. Liquidation Flush Detection
Sharp impulsive candles with abnormally large wicks often represent liquidation cascades rather than healthy trend continuation.
The script identifies liquidation behavior by measuring:
•Wick-to-body imbalance
•Sudden expansion followed by rejection
•Temporary price inefficiencies
These flushes commonly occur near:
•Session highs/lows
•Range extremes
•Trend exhaustion points
Such events often lead to rebalance moves , where price partially or fully fills the wick.
🔹 3. Orderblock Reaction Zones
Orderblocks represent areas where heavy participation occurred before a strong displacement move.
The script highlights:
•Clean bullish and bearish orderblock structures
•Zones formed during consolidation prior to expansion
•Areas likely to be defended when revisited
Orderblocks with minimal noise and clean departure are prioritized, as they often reflect institutional positioning rather than retail activity.
These zones are intended as reaction areas , not automatic entry signals.
🔹 4. London Session Liquidity Sweep Model
The London session frequently establishes the initial daily high or low.
Later in the session or during New York, price often:
•Sweeps internal liquidity around that level
•Rejects after the sweep
•Continues with the higher-timeframe bias
The script monitors London session behavior and marks:
•Liquidity runs above/below London highs and lows
•Rejections back inside the prior structure
This model is especially effective when combined with broader daily context.
🔹4. How the Components Work Together
The framework is designed as a context stack , not a checklist of signals:
Liquidity Event → Location → Timing → Trader Execution
Each model reinforces the others:
•Failed breakouts often occur after liquidity sweeps
•Liquidation wicks frequently form near orderblocks
•London sweeps often trigger failed momentum moves
•Confluence increases probability, not certainty
🔹 Practical Usage Guide
✔ Identify context
Determine whether price is approaching a range extreme, session level, or prior participation zone.
✔ Wait for a liquidity event
Look for a sweep, failed breakout, or liquidation wick.
✔ Observe reaction
Rejection, displacement, or reclaim behavior provides confirmation.
✔ Execute manually
Stops are commonly placed beyond the liquidity extreme.
Targets are typically internal liquidity, prior highs/lows, or imbalance zones.
The indicator does not manage trades or enforce rules.
Execution and risk management remain the trader’s responsibility.
🔹 5. Originality & Design Notes
This script does not replicate or bundle existing indicators.
It introduces:
•A multi-model liquidity entry framework
•Structural failed breakout detection
•Wick-based liquidation imbalance logic
•Session-aware liquidity sweep visualization
•A unified, minimal, non-lagging design
All concepts are based on observable market behavior and integrated into a single analytical tool.
🔹 6. Suitable Markets & Timeframes
Works best on:
•XAUUSD
•Major FX pairs
•Indices
•Liquid crypto markets
Recommended timeframes:
•1m
•5m
•15m
•30m
🔹7. Limitations & Notes
•This is an analytical framework , not a trading system
•All markings are confirmed at candle close (non-repainting)
•No open interest or order flow data is used
•Results depend on user interpretation and execution
•Best used alongside session bias and higher-timeframe structure
Disclaimer
This script is provided for educational and informational purposes only.
It does not constitute financial advice, investment advice, or a recommendation to buy or sell any instrument.
Trading involves risk, and losses can exceed initial deposits.
The author assumes no responsibility for trading decisions made using this tool.
Users are strongly encouraged to test this script in demo or simulation environments and to apply proper risk management, position sizing, and personal discretion at all times.
By using this script, you acknowledge and accept all associated risks.

One for AllOne for All (OFA) - Complete ICT Analysis Suite
Version 3.3.0 by theCodeman
📊 Overview
One for All (OFA) is a comprehensive TradingView indicator designed for traders who follow Inner Circle Trader (ICT) concepts. This all-in-one tool combines essential ICT analysis features—sessions, kill zones, previous period levels, and higher timeframe candles with Fair Value Gaps (FVGs) and Volume Imbalances (VIs)—into a single, highly customizable indicator. Whether you're a beginner learning ICT concepts or an experienced trader refining your edge, OFA provides the visual structure needed for precise market analysis and execution.
✨ Key Features
- 🏷️ Customizable Watermark**: Display your trading identity with customizable titles, subtitles, symbol info, and full style control
- 🌍 Trading Sessions**: Visualize Asian, London, and New York sessions with high/low lines, range boxes, and open/close markers
- 🎯 Kill Zones**: Highlight 5 critical ICT kill zones with precise timing and visual boxes
- 📈 Previous Period H/L**: Track Daily, Weekly, and Monthly highs/lows with customizable styles and lookback periods
- 🕐 Higher Timeframe Candles**: Display up to 5 HTF timeframes with OHLC trace lines, timers, and interval labels
- 🔍 FVG & VI Detection**: Automatically detect and visualize Fair Value Gaps and Volume Imbalances on HTF candles
- ⚙️ Universal Timezone Support**: Works globally with GMT-12 to GMT+14 timezone selection
- 🎨 Full Customization**: Control colors, styles, visibility, and layout for every feature
🚀 How to Use
Watermark Setup
The watermark overlay helps you identify your charts and maintain focus on your trading principles:
1. Enable/disable watermark via "Show Watermark" toggle
2. Customize the title (default: "Name") to display your trading name or account identifier
3. Set up to 3 subtitles (default: "Patience", "Confidence", "Execution") as trading reminders
4. Choose position (9 locations available), size, color, and transparency
5. Toggle symbol and timeframe display as needed
Use Case: Display your trading principles or account name for multi-monitor setups or content creation.
Trading Sessions Analysis
Sessions define market character and liquidity availability:
1. Enable "Show All Sessions" to visualize all three sessions
2. Adjust timezone to match your local market (default: UTC-5 for EST)
3. Customize session times if needed (defaults cover standard hours)
4. Enable session range boxes to see consolidation zones
5. Use session high/low lines to identify key levels for the current session
6. Enable open/close markers to track session transitions
Use Case: Identify which session you're trading in, track session highs/lows for liquidity, and anticipate session transition volatility.
Kill Zones Trading
Kill zones are ICT's high-probability trading windows:
1. Enable individual kill zones or use "Show All Kill Zones"
2. **Asian Kill Zone** (2000-0000 GMT): Early positioning and smart money accumulation
3. **London Kill Zone** (0300-0500 GMT): European market opening volatility
4. **NY AM Kill Zone** (0930-1100 EST): Post-NYSE open expansion
5. **NY Lunch Kill Zone** (1200-1300 EST): Midday consolidation or manipulation
6. **NY PM Kill Zone** (1330-1600 EST): Afternoon positioning and closes
7. Customize colors and times to match your trading style
8. Set max days display to control historical visibility (default: 30 days)
Use Case: Focus entries during high-probability windows. Watch for liquidity sweeps at kill zone openings and institutional positioning.
Previous Period High/Low Levels
Previous period levels act as magnetic price targets and support/resistance:
1. Enable Daily (PDH/PDL), Weekly (PWH/PWL), or Monthly (PMH/PML) levels individually
2. Set lookback period (how many previous periods to display)
3. Choose line style: Solid (current emphasis), Dashed (standard), or Dotted (subtle)
4. Customize colors per timeframe for visual hierarchy
5. Adjust line width (1-5) for visibility preference
6. Enable gradient effect to fade older periods
7. Position labels left or right based on chart layout
8. Customize label text for your preferred notation
Use Case: Identify key levels where price is likely to react. Daily levels work on intraday timeframes, Weekly on daily charts, Monthly for swing trading.
Higher Timeframe (HTF) Candles
HTF candles reveal the larger market context while trading lower timeframes:
1. Enable up to 5 HTF slots simultaneously (default: 5m, 15m, 1H, 4H, Daily)
2. Choose display mode: "Below Chart" (stacked rows) or "Right Side" (compact column)
3. Customize timeframe, colors (bull/bear), and titles for each slot
4. **OHLC Trace Lines**: Visual lines connecting HTF candle levels to chart bars
5. **HTF Timer**: Countdown showing time remaining until HTF candle close
6. **Interval Labels**: Display day of week (Daily+) or time (intraday) on each candle
7. For Daily candles: Choose open time (Midnight, 8:30, 9:30) to match your market structure preference
Use Case: Trade lower timeframes while respecting higher timeframe structure. Watch for HTF candle closes to confirm directional bias.
FVG & VI Detection
Fair Value Gaps and Volume Imbalances highlight inefficiencies that price often revisits:
1. **Fair Value Gaps (FVGs)**: Detected when HTF candle wicks don't overlap between 3 consecutive candles
- Bullish FVG: Gap between candle 1 high and candle 3 low (green box by default)
- Bearish FVG: Gap between candle 1 low and candle 3 high (red box by default)
2. **Volume Imbalances (VIs)**: Similar detection but focuses on body gaps
- Bullish VI: Gap between candle 1 close and candle 3 open
- Bearish VI: Gap between candle 1 open and candle 3 close
3. Enable FVG/VI detection per HTF slot individually
4. Customize colors and transparency for each imbalance type
5. Boxes appear on chart at formation and remain visible as retracement targets
**Use Case**: Identify high-probability retracement zones. Price often returns to fill FVGs and VIs before continuing the trend. Use as entry zones or profit targets.
🎨 Customization
OFA is built for flexibility. Every feature includes extensive customization options:
Visual Customization
- **Colors**: Independent color control for every element (sessions, kill zones, lines, labels, FVGs, VIs)
- **Transparency**: Adjust box and label transparency (0-100%) for clean charts
- **Line Styles**: Choose Solid, Dashed, or Dotted for previous period lines
- **Sizes**: Control text size, line width, and box borders
- **Positions**: Place watermark in 9 positions, labels left/right
Layout Control
- **HTF Display Mode**: "Below Chart" for detailed analysis, "Right Side" for space efficiency
- **Drawing Limits**: Set max days for sessions/kill zones to manage chart clutter
- **Lookback Periods**: Control how many previous periods to display (1-10)
- **Gradient Effects**: Enable fading for older previous period lines
Timing Adjustments
- **Timezone**: Universal GMT offset selector (-12 to +14) for global markets
- **Session Times**: Customize each session's start/end times
- **Kill Zone Times**: Adjust kill zone windows to match your market's characteristics
- **Daily Open**: Choose Midnight, 8:30, or 9:30 for Daily HTF candle open time
💡 Best Practices
1. Start Simple: Enable one feature at a time to learn how each element affects your analysis
2. Match Your Timeframe: Use Daily levels on intraday charts, Weekly on daily charts, HTF candles one or two levels above your trading timeframe
3. Kill Zone Focus: Concentrate your trading activity during kill zones for higher probability setups
4. HTF Confirmation: Wait for HTF candle closes before committing to directional bias
5. FVG/VI Entries: Look for price to return to unfilled FVGs/VIs for entry opportunities with favorable risk/reward
6. Customize Colors: Use a consistent color scheme that matches your chart theme and reduces visual fatigue
7. Reduce Clutter: Disable features you're not actively using in your current trading plan
8. Session Context: Understand which session controls the market—trade with session direction or anticipate reversals at session transitions
⚙️ Settings Guide
OFA organizes settings into logical groups for easy navigation:
- **═══ WATERMARK ═══**: Title, subtitles, position, style, symbol/timeframe display
- **═══ SESSIONS ═══**: Enable/disable sessions, times, colors, high/low lines, boxes, markers
- **═══ KILL ZONES ═══**: Individual kill zone toggles, times, colors, max days display
- **═══ PREVIOUS H/L - DAILY ═══**: Daily high/low lines, style, color, lookback, labels
- **═══ PREVIOUS H/L - WEEKLY ═══**: Weekly high/low lines, style, color, lookback, labels
- **═══ PREVIOUS H/L - MONTHLY ═══**: Monthly high/low lines, style, color, lookback, labels
- **═══ HTF CANDLES ═══**: Global display mode, layout settings
- **═══ HTF SLOT 1-5 ═══**: Individual HTF configuration (timeframe, colors, title, FVG/VI detection, trace lines, timer, interval labels)
Each setting includes tooltips explaining its function. Hover over any input for detailed guidance.
📝 Final Notes
One for All (OFA) represents a complete ICT analysis toolkit in a single indicator. By combining watermark customization, session visualization, kill zone highlighting, previous period levels, and higher timeframe candles with FVG/VI detection, OFA eliminates the need for multiple indicators cluttering your chart.
**Version**: 3.3.0
**Author**: theCodeman
**Pine Script**: v6
**License**: Mozilla Public License 2.0
Start with default settings to learn the indicator's structure, then customize extensively to match your personal trading style. Remember: tools provide information, but your edge comes from disciplined execution of a proven strategy.
Happy Trading! 📈

BORSA 321 - Care PackageOverview
Care Package is a complete higher-timeframe and intraday context tool designed to map out every important environmental factor on your chart: sessions, opening levels, gaps, market structure, order blocks, fair value gaps, volume imbalance and more.
It automatically plots:
Sessions / killzones (Asia, London, New York AM/Lunch/PM)
Key opening levels (00:00, 08:30, 09:30, 13:30)
Previous day AM/PM high–low ranges
New Day and New Week Opening Gaps (NDOG / NWOG)
RTH gap and RTH zone levels
Multi-timeframe Fair Value Gaps (up to 4)
Fractals and Order Blocks (with optional FVG confirmation)
Market structure (HH/HL/LL/LH, CHoCH, BOS)
Volume Imbalance zones with mitigation logic
All session logic runs on IANA time zones (like America/New_York), giving accurate sessions and market opens regardless of DST or broker feed.
Care Package serves as the full “context layer” for intraday execution charts.
What It Shows
1. Sessions / Killzones
The indicator automatically highlights:
Asia Session
London Session
New York AM
New York Lunch
New York PM
Each session displays:
A high–low range box
Labels for session high and session low
A midline showing the mean price
Optional forward extensions of session levels to the current bar
This cleanly outlines intraday phases for ICT/SMC execution.
2. Opening Price Levels
Key market open levels tracked:
00:00
08:30
09:30
13:30
For each open, the script draws:
A horizontal line at the opening price
A label showing time and price
An optional vertical line marking the opening bar
These opens often act as liquidity or reversal areas.
3. Previous Day AM/PM Levels
The script splits the prior day into:
Previous Day AM (first half)
Previous Day PM (second half)
Both provide:
PD AM High, PD AM Low
PD PM High, PD PM Low
Forward-projected levels
Labels for easy identification
Useful for navigating intraday targets and reaction zones.
4. Last N Days High/Low
Tracks a rolling daily range:
Each day’s High and Low
Labels containing the date
Forward extension into today’s price action
This shows where price sits relative to recent daily extremes.
5. New Day & New Week Opening Gaps (NDOG / NWOG)
The script automatically identifies:
NDOG (New Day Open Gap)
NWOG (New Week Open Gap)
Each gap includes:
A shaded zone between the two opens
Labels showing the gap type and date/week
Forward extension (optional)
Limiting the number of historical gaps (optional)
Critical for identifying unfilled imbalance zones across sessions and weeks.
6. RTH Gap & RTH Zone
You define RTH open/close times, and the indicator:
Detects RTH gaps
Draws a full zone based on direction
Plots subdivision lines (top, 75%, mid, 25%, bottom)
Extends the RTH Close reference line forward
Can extend old RTH zones automatically
Ideal for futures traders and equities.
7. Higher-Timeframe Fair Value Gaps (up to 4 TFs)
Supports up to four selectable FVG timeframes such as:
Chart timeframe
5m, 15m, 1H, 4H, 1D, 1W, 1M
Each FVG includes:
Top and bottom boundary
A midline (mean threshold)
Colored bullish or bearish fill
A label showing FVG + timeframe
Automatic cleanup when mitigated (close/wick based)
You get a clean and accurate HTF FVG map without clutter.
8. Fractals & Order Blocks
Fractals:
Standard or 5-bar fractals
Plotted as swing highs and lows
Order Blocks:
Bullish OB → down candle before up displacement
Bearish OB → up candle before down displacement
Optionally require OB to be near an FVG
Wick-based or body-based OB size
Forward-projected OB boxes
Auto-delete after mitigation
This keeps your OBs clean and execution-focused.
9. Market Structure (HH/HL/LL/LH, CHoCH, BOS)
The indicator automatically detects:
HH (Higher High)
HL (Higher Low)
LH (Lower High)
LL (Lower Low)
And also identifies:
CHoCH (Change of Character)
BOS (Break of Structure)
Each break includes:
A horizontal level at the break point
A color-coded label
Bullish (green) or bearish (red) styling
A complete market structure map is built automatically.
10. Volume Imbalances (VI)
Detects and displays:
Bullish VI (VI+)
Bearish VI (VI-)
Features:
Configurable colors
Custom label size
Max visible boxes
Extension until mitigation
Automatic mitigation detection (close or wick)
Highlight when price enters an active VI
Perfect for tracking aggressive buying/selling footprints.
11. Timezone & Date/Time Widget
Uses IANA timezones for:
Accurate session boundaries
Proper DST handling
Multi-market consistency
Also includes a small on-chart table showing:
Your timezone date/time
Exchange timezone date/time
Great for globally active traders.
12. Max Display Timeframe
To prevent clutter, the script disables visuals above a chosen timeframe.
If you exceed it:
A clean on-chart message appears
Tells you to lower your chart TF or adjust the Max Display TF
Keeps charts fast and clean
Key Inputs & Customization
Timezone (IANA format)
Max Display Timeframe
Session/Killzone toggles, colors, naming
Opening levels (00:00 / 08:30 / 09:30 / 13:30)
Previous Day AM/PM highs/lows
NDOG / NWOG gap settings
RTH gap settings
FVG batching (4 independent timeframes)
Fractal type
Order Block settings (range type, deletion, FVG filter)
Market structure settings
Volume Imbalance settings
Date/time widget settings
Everything is modular — turn features on/off individually.
How It Helps Traders
For Intraday Traders / Scalpers:
Session mapping for timing setups
Exact key opening prices
RTH gaps and internals
Precise daily AM/PM high–low context
HTF FVGs, OBs, VI zones for higher-timeframe bias
Real-time CHoCH/BOS for entry timing
For Swing Traders:
Daily/weekly context plotted automatically
NDOG, NWOG, RTH gap awareness
Macro structure levels
HTF FVGs and OBs for HTF targets

ICT/SMC DOL Detector PRO (Final)This indicator is designed to operate only on the 1-hour timeframe.
The ICT/SMC DOL Detector PRO is an educational indicator designed to identify and visualize Draw on Liquidity (DOL) levels across multiple time-frames. It tracks unmitigated daily highs and lows, clusters them into zones, and calculates confidence scores based on multiple factors including time decay, cluster size, and time-frame alignment.
This indicator is based on ICT (Inner Circle Trader) concepts and liquidity theory, which suggests that price tends to seek out areas of concentrated unfilled orders before reversing or continuing its trend.
What is a DOL (Draw on Liquidity)?
A Draw on Liquidity represents a daily high or low that has not been revisited (mitigated) by price. These levels act as "magnets" that draw price toward them because:
1. They represent untapped liquidity pools where unfilled orders exist
2. Market makers and institutions often target these levels to fill large orders
3. Price is drawn to these zones to clear pending orders
4. They can serve as potential reversal or continuation zones once liquidity is taken
Methodology
1. Level Tracking
The indicator monitors daily session highs and lows on the 1-hour time-frame, tracking:
- Session high price and time of formation
- Session low price and time of formation
- Whether each level has been breached (mitigated)
- Time elapsed since level formation
2. Clustering Algorithm
Unmitigated levels within a defined tolerance (default 0.5% of price) are grouped together to identify zones where multiple DOLs cluster. Larger clusters indicate stronger liquidity pools.
3. Confidence Scoring (The "AI" Logic)
Each DOL receives a confidence score (0-100%) based on three weighted factors. This is the core "AI" intelligence of the indicator:
**Factor 1: Cluster Size (50% weight)**
- Counts how many unmitigated levels exist within 0.5% of the price zone
- Formula: (levels_in_cluster / total_unmitigated_levels) × 50
- Logic: More unfilled orders clustered together = stronger liquidity pool = higher confidence
- Example: If 5 out of 10 total unmitigated levels cluster at 27,500, cluster score = (5/10) × 50 = 25%
**Factor 2: Time Decay (25% weight)**
- Calculates age of the level since formation
- Fresh levels (< 1 week old): Full 25% score
- Aging penalty: Loses 5% per week of age
- Maximum penalty: 25% (very old levels = 0% time score)
- Formula: max(0, 25 - (weeks_old × 5))
- Logic: Recent liquidity is more relevant than old liquidity that price has ignored for months
**Factor 3: Timeframe Alignment (25% weight)**
- Checks how many timeframes (1H, 4H, D1, W1) point in the same direction
- If multiple timeframes identify DOLs on the same side (all bullish or all bearish): Higher score
- If mixed signals: Lower score
- Formula: (aligned_timeframes / total_timeframes) × 25
- Logic: When multiple timeframes agree, the liquidity zone is validated across different time perspectives
**Total Confidence Score:**
```
Confidence = Cluster_Score + Time_Score + Alignment_Score
= (0-50%) + (0-25%) + (0-25%)
= 0-100%
```
**Example Calculation:**
```
DOL at 27,500:
- 6 out of 12 unmitigated levels cluster here → (6/12) × 50 = 25%
- Level is 2 weeks old → 25 - (2 × 5) = 15%
- 3 out of 4 timeframes bullish toward this level → (3/4) × 25 = 18.75%
- Total Confidence = 25% + 15% + 18.75% = 58.75% ≈ 59%
```
This mathematical approach removes subjectivity and provides objective, data-driven confidence scoring.
4. Multi-Timeframe Analysis
The indicator analyzes DOLs across four timeframes:
- **1H:** Intraday levels (fastest reaction)
- **4H:** Short-term swing levels
- **Daily:** Intermediate-term levels
- **Weekly:** Long-term structural levels
For each timeframe, it identifies:
- Highest confidence unmitigated high
- Highest confidence unmitigated low
- Directional bias (bullish if high > low confidence, bearish if low > high confidence)
5. Primary DOL Selection (AI Auto-Selection Logic)
When "Show AI DOL" is enabled, the indicator uses an automated selection algorithm to identify the most important targets:
**Step 1: Collect All Candidates**
The algorithm gathers all identified DOLs from all timeframes (1H, 4H, D1, W1) that meet minimum criteria:
- Must be unmitigated (not yet swept)
- Must have confidence score > 0%
- Must have at least 1 level in cluster
**Step 2: Calculate Confidence for Each**
Each candidate DOL receives its confidence score using the three-factor formula described above (Cluster + Time + Alignment).
**Step 3: Sort by Confidence**
All candidates are ranked from highest to lowest confidence score.
**Step 4: Select Primary and Secondary**
- **P1 (Primary DOL):** The DOL with the absolute highest confidence score
- **P2 (Secondary DOL):** The DOL with the second highest confidence score
**Why This Matters:**
Instead of manually scanning multiple timeframes and guessing which level is most important, the AI objectively identifies the two highest-probability liquidity targets based on quantifiable data.
**Example AI Selection:**
```
Available DOLs:
- 1H High: 27,400
- 4H High: 27,500
- D1 High: 27,500 ← P1 (Highest)
- W1 High: 27,650 ← P2 (Second Highest)
- 1H Low: 26,800
- D1 Low: 26,500
AI Selection:
P1 = 27,500 (Daily High with 92% confidence)
P2 = 27,650 (Weekly High with 88% confidence)
```
This provides a data-driven target selection rather than subjective manual interpretation. The AI removes emotion and bias, selecting targets based purely on mathematical probability.
Features
Why "AI" DOL?
The term "AI" in this indicator refers to the automated algorithmic selection process, not machine learning or neural networks. Specifically:
**What the AI Does:**
- Automatically evaluates all available DOLs across all timeframes
- Applies a weighted scoring algorithm (Cluster 50%, Time 25%, Alignment 25%)
- Objectively ranks DOLs by probability
- Selects the top 2 highest-confidence targets (P1 and P2)
- Removes human bias and emotion from target selection
**What the AI Does NOT Do:**
- It does not use machine learning or train on historical data
- It does not predict future price movements
- It does not adapt or "learn" over time
- It does not guarantee accuracy
The "AI" is simply an automated decision-making algorithm that applies consistent mathematical rules to identify the most statistically significant liquidity zones. Think of it as a "smart filter" rather than artificial intelligence in the traditional sense.
Visual Components
**Daily Level Lines:**
- Green lines: Unmitigated (not yet breached) levels
- Red lines: Mitigated (already breached) levels
- Dots at origin point showing where level was formed
- X marker when level gets breached
- Lines extend forward to show projection
**DOL Labels:**
- Display timeframe (1H, 4H, D1, W1) or "DOL" for AI selection
- Show confidence percentage in brackets
- Color-coded by timeframe:
- Lime: AI DOL (Smart selection)
- Aqua: 1-hour timeframe
- Blue: 4-hour timeframe
- Purple: Daily timeframe
- Orange: Weekly timeframe
**Info Box (Top Right):**
Displays comprehensive liquidity metrics:
- Total levels tracked
- Active (unmitigated) levels count
- Cleared (mitigated) levels count
- Flow direction (BID PRESSURE / OFFER PRESSURE)
- Most recent sweep
- Primary and Secondary DOL targets
- Multi-timeframe bias analysis
- Overall directional bias
Settings Explained
**Daily Levels Group:**
- Show Daily Highs/Lows: Toggle visibility of all daily level tracking
- Unbreached Color: Color for levels not yet hit
- Breached Color: Color for levels that have been swept
- Show X on Breach: Display marker when level is breached
- Show Dot at Origin: Display marker at level formation point
- Line Width: Thickness of level lines (1-5)
- Line Extension: How many bars forward to project (1-24)
- Max Days to Track: Historical lookback period (5-200 days)
**DOL Settings Group:**
- Cluster Tolerance %: Price range to group DOLs (0.1-2.0%)
- Show Price on Labels: Display actual price value on labels
- Backtest Mode: Only show recent labels for clean historical analysis
- Labels Lookback: Number of bars to show labels when backtesting (10-500)
**Info Box Group:**
- Show Info Box: Toggle info panel visibility
**DOL Toggles Group:**
- Show AI DOL: Display smart auto-selected primary target
- Show 1HR DOL: Display 1-hour timeframe DOLs
- Show 4HR DOL: Display 4-hour timeframe DOLs
- Show Daily DOL: Display daily timeframe DOLs
- Show Weekly DOL: Display weekly timeframe DOLs
**Advanced Group:**
- Manual Mode: Simplified display showing only daily high/low clusters
How to Use This Indicator
Educational Application
This indicator is intended for educational purposes to help traders:
1. **Understand Liquidity Concepts:** Visualize where unfilled orders may exist
2. **Identify Key Levels:** See where price may be drawn to
3. **Analyze Market Structure:** Understand how price interacts with liquidity
4. **Study Multi-Timeframe Alignment:** Observe when multiple timeframes agree
5. **Learn ICT Concepts:** Apply liquidity theory in practice
Interpretation Guidelines
**BID PRESSURE (Flow):**
When lows are being swept more than highs, it suggests:
- Sell-side liquidity being taken
- Potential for upward move to unfilled buy-side liquidity
- Market may be clearing the way for a bullish move
**OFFER PRESSURE (Flow):**
When highs are being swept more than lows, it suggests:
- Buy-side liquidity being taken
- Potential for downward move to unfilled sell-side liquidity
- Market may be clearing the way for a bearish move
**Confidence Scores:**
- 90-100%: Very high probability zone (strong cluster, recent, aligned)
- 80-89%: High probability zone (good cluster, relatively recent)
- 70-79%: Moderate probability zone (decent cluster or older)
- 60-69%: Lower probability zone (small cluster or very old)
- Below 60%: Weak zone (minimal confluence)
**Timeframe Analysis:**
- All timeframes LONG: Strong bullish alignment
- All timeframes SHORT: Strong bearish alignment
- Mixed: Conflicting signals, exercise caution
- Higher timeframes (D1, W1) carry more weight than lower (1H, 4H)
**DIRECTIONAL Indicator:**
- BULLISH: Overall bias suggests upward movement toward buy-side DOLs
- BEARISH: Overall bias suggests downward movement toward sell-side DOLs
- NEUTRAL: No clear directional bias, conflicting signals
Practical Application Examples
**Example 1: Bullish Setup**
```
Flow: BID PRESSURE (lows being swept)
P1: 27,500 (price above current market)
D1: LONG 27,500
W1: LONG 27,650
DIRECTIONAL: BULLISH
```
Interpretation: Price has cleared sell-side liquidity. High confidence buy-side DOL at 27,500. Daily and Weekly timeframes aligned bullish. Watch for move toward 27,500 target.
**Example 2: Bearish Setup**
```
Flow: OFFER PRESSURE (highs being swept)
P1: 26,200 (price below current market)
D1: SHORT 26,200
W1: SHORT 26,100
DIRECTIONAL: BEARISH
```
Interpretation: Price has cleared buy-side liquidity. High confidence sell-side DOL at 26,200. Daily and Weekly timeframes aligned bearish. Watch for move toward 26,200 target.
**Example 3: Mixed Signals - Wait**
```
Flow: BID PRESSURE
P1: 26,800
D1: LONG 27,000
W1: SHORT 26,200
DIRECTIONAL: NEUTRAL
```
Interpretation: Conflicting signals. Flow suggests up, but Weekly bias is down. Confidence scores moderate. Better to wait for clarity.
Important Considerations
This Indicator Does NOT:
- Predict the future
- Guarantee profitable trades
- Provide buy/sell signals
- Replace proper risk management
- Work in isolation without other analysis
This Indicator DOES:
- Visualize liquidity concepts
- Identify potential target zones
- Show timeframe alignment
- Calculate objective confidence scores
- Help understand market structure
Proper Usage:
1. Use as one component of a complete trading strategy
2. Combine with price action analysis
3. Confirm with other technical indicators
4. Consider fundamental factors
5. Always use proper risk management
6. Backtest any strategy before live trading
Risk Disclaimer
**FOR EDUCATIONAL PURPOSES ONLY**
This indicator is for educational purposes only. Trading financial markets involves substantial risk of loss. Past performance does not guarantee future results. Always conduct your own research and consult with a financial advisor before making trading decisions.
**Important Limitations:**
- No indicator is 100% accurate, including the AI selection
- The "AI" is an automated algorithm, not predictive artificial intelligence
- DOL levels can be swept and price can continue in the same direction
- Confidence scores are mathematical calculations, not predictions or probabilities of success
- High confidence does not mean guaranteed profit
- Markets can remain irrational longer than you can remain solvent
- Always use stop losses and proper position sizing
**Understanding the AI Component:**
The AI auto-selection feature uses a fixed mathematical formula to rank DOLs. It does not:
- Predict where price will go
- Learn from past performance
- Adapt to market conditions
- Guarantee any level of accuracy
The confidence score represents the mathematical strength of a liquidity cluster based on objective factors (cluster size, recency, timeframe alignment), NOT a probability of the trade succeeding.
**Risk Warning:**
Trading is risky. Most traders lose money. This indicator cannot change that fundamental reality. Use it as an educational tool to understand market structure, not as a trading signal or system.
Technical Requirements
- **Timeframe:** Best used on 1-hour charts (required for accurate daily level tracking)
- **Markets:** Works on any market (forex, crypto, stocks, futures, indices)
- **Updates:** Real-time calculation on each bar close
- **Resources:** Uses max 500 lines and 500 labels (TradingView limits)
Backtesting Features
The indicator includes "Backtest Mode" to keep historical charts clean:
- When enabled, only shows labels from recent bars
- Adjustable lookback period (10-500 bars)
- All lines remain visible
- Helps review past setups without clutter
To use:
1. Enable "Backtest Mode" in settings
2. Adjust "Labels Lookback" to desired period
3. Review historical price action
4. Disable for live trading
Credits and Methodology
This indicator implements concepts from:
- ICT (Inner Circle Trader) liquidity theory
- Smart Money Concepts (SMC)
- Order flow analysis
- Multi-timeframe analysis principles
The clustering algorithm, confidence scoring, and timeframe synthesis are original implementations designed to quantify and visualize these concepts.
Version History
**v1.0 - Initial Release**
- Multi-timeframe DOL detection
- Confidence scoring system
- Info box with liquidity metrics
- Backtest mode for clean charts
- Black/white professional theme
Support and Updates
For questions, feedback, or suggestions, please use the TradingView comments section. Updates and improvements will be released as needed based on user feedback and market evolution.
**Remember:** This is an educational tool. Successful trading requires knowledge, discipline, risk management, and continuous learning. Use this indicator to enhance your understanding of market structure and liquidity, not as a standalone trading system.

Atif's Liquidity Toolkit💎 GENERAL OVERVIEW:
Atif’s Liquidity Toolkit is a price-action-based indicator used to identify Buyside & Sellside Liquidity Levels, Liquidity Sweeps, FVG Sweeps, and Buy/Sell signals, following specific rules from Atif Hussain.
This indicator was developed by Flux Charts in collaboration with Atif Hussain.
🔹Purpose of this indicator:
The purpose of Atif’s Liquidity Toolkit is to help traders understand where liquidity is forming, when it’s being taken, and how momentum shifts immediately afterward. It automates the entire process of identifying buyside & sellside liquidity, detecting liquidity sweeps, and confirming whether displacement followed through a Fair Value Gap. The goal is to give traders a consistent, rule-based framework to interpret market structure.
🎯ATIF’S LIQUIDITY TOOLKIT FEATURES:
Atif’s Liquidity Toolkit indicator includes 6 main features:
Fair Value Gaps
Multi-Timeframe Liquidity Levels
Liquidity Sweeps
Fair Value Gap Sweeps
Buy & Sell Signals with Take-Profit & Stop-Loss Levels
Alerts
1️⃣Fair Value Gaps
🔹What is a Fair Value Gap?:
A Fair Value Gap (FVG) is an area where the market’s perception of fair value suddenly changes. On your chart, it appears as a three-candle pattern: a large candle in the middle, with smaller candles on each side that don’t fully overlap it. A bullish FVG forms when a bullish candle is between two smaller bullish/bearish candles, where the first and third candles’ wicks don’t overlap each other at all. A bearish FVG forms when a bearish candle is between two smaller bullish/bearish candles, where the first and third candles’ wicks don’t overlap each other at all.
Bullish & Bearish FVGs:
In the settings, you can toggle on/off FVGs, choose the invalidation method, adjust the sensitivity, and toggle on FVG Midline & Labels.
🔹Invalidation Method:
The Invalidation Method setting allows traders to choose how an FVG is invalidated. You can choose between Close and Wick.
Close: A candle must close below a bullish FVG or above a bearish FVG to invalidate it.
Wick: A candle’s wick must go below a bullish FVG or above a bearish FVG to invalidate it.
🔹Sensitivity:
The sensitivity setting determines the minimum gap size required for an FVG detection. A higher sensitivity will filter out smaller gaps, while a lower sensitivity will detect more frequent, smaller gaps. Setting the sensitivity to 0 will display all gaps, regardless of their size.
On the left, the sensitivity is 5. On the right, the sensitivity is 0.
🔹Midline:
When enabled, a dashed line is drawn at the center of the FVG.
🔹Labels:
When enabled, a text label will be plotted with the gap, clearly identifying the zone as a FVG.
2️⃣ Multi-Timeframe Liquidity Levels
The indicator automatically detects and plots Buyside Liquidity (BSL) & Sellside Liquidity (SSL) Levels across up to three timeframes simultaneously.
🔹What is Buyside Liquidity?
Buyside Liquidity (BSL) represents price levels where many buy stop orders are sitting, usually from traders holding short positions. When price moves into these areas, those stop-loss orders get triggered and short sellers are forced to buy back their positions. These zones often form above key highs such as the previous day, week, or month. Understanding BSL is important because when price reaches these levels, the sudden wave of buy orders can create sharp reactions or reversals as liquidity is taken from the market.
🔹What is Sellside Liquidity?
Sellside Liquidity (SSL) represents price levels where many sell stop orders are waiting, usually from traders holding long positions. When price drops into these areas, those stop-loss orders are triggered and long traders are forced to sell their positions. These zones often form below key lows such as the previous day, week, or month. Understanding SSL is important because when price reaches these levels, the surge of sell orders can cause sharp reactions or reversals as liquidity is taken from the market.
Atif’s Liquidity Toolkit indicator automatically plots Buyside & Sellside Liquidity levels using the following levels:
Previous Day High (PDH) & Previous Day Low (PDL)
Previous Week High (PWH) & Previous Week Low (PWL)
Previous Month High (PMH) & Previous Month Low (PML)
Asia Session Highs/Lows
London Session Highs/Lows
New York Session Highs/Lows
The session start and end times are not customizable. The following times in EST are used for each session:
Asia Session: 20:00-00:00
London Session: 02:00-05:00
New York Sessions:
NY AM: 09:30-11:00
NY Lunch: 12:00-13:00
NY PM: 14:00-16:00
Users can also plot swing highs/lows using a lookback period and choosing the higher timeframe. Users can choose two custom higher timeframes and also enable swing highs/lows from the current chart’s timeframe.
There are three settings to customize for the current chart’s timeframe and higher timeframes:
Current TF - when toggled on, swing highs/lows will be plotted from the chart’s timeframe using the pivot length input
HTF 1 - when toggled on, swing highs/lows will be plotted from the user-inputted timeframe using the pivot length input
HTF 2 - when toggled on, swing highs/lows will be plotted from the user-inputted timeframe using the pivot length input
The Pivot Length controls how far back the indicator checks to confirm whether a candle’s high or low is a true swing point (also called a “pivot”). When detecting a swing high, the indicator checks if that candle’s high is higher than the highs of the previous X candles and the next X candles. For a swing low, it checks if the candle’s low is lower than the lows of the previous X candles and the next X candles. The number X comes from your Pivot Length setting.
A lower Pivot Length input (for example, 3 or 4) means the indicator only looks at a few candles on each side, so it will detect more swing points, including smaller, less significant ones. A higher Pivot Length input (for example, 20 or 25) makes the indicator look at more candles on each side, so it only marks major turning points that stand out clearly on the chart.
In short:
Low Pivot Length = more frequent, smaller levels (short-term focus)
High Pivot Length = fewer, stronger levels (major swing focus)
The Pivot Length input for each setting (Current TF, HTF 1, and HTF 2) are displayed below in the red boxes:
Each liquidity level is plotted with a text label, making it easy to identify where a level came from. You can turn off the ‘Show Levels’ setting if you don’t want to see the levels on your chart.
Please note: Liquidity Levels play a key role in finding liquidity sweeps, FVG Sweeps, and Buy/Sell signals. Keeping the levels turned off will not stop the indicator from using the levels that are enabled from being used for the other features mentioned.
3️⃣Liquidity Sweeps:
The indicator automatically detects bullish and bearish liquidity sweeps using the liquidity levels you have enabled.
🔹What is a Liquidity Sweep?
A liquidity sweep is a market phenomenon where significant players, such as institutional traders, deliberately drive prices through key levels to trigger clusters of pending buy or sell orders. It’s how the market gathers the liquidity needed for larger participants to enter positions.
Traders often place stop-loss orders around obvious highs and lows, such as the previous day’s, week’s, or month’s levels. When price pushes through one of these areas, it triggers the stops placed there and generates a burst of volume. This often creates a short-term fake-out before the market reverses in the opposite direction.
By detecting these sweeps in real time, traders can identify potential reversal areas or “trap” areas where liquidity has been taken.
🔹Bullish Liquidity Sweep
These occur when price dips below a Sellside Liquidity (SSL) level, taking out the stop-loss orders placed by long traders below that low. The indicator marks a zone around the candle that swept the SSL to highlight where liquidity was removed from the market.
When this happens, it shows that the market just cleared out sell-side liquidity, meaning traders who were long had their stops hit. This is often followed by a reversal or strong reaction upward, because the market no longer has pending liquidity to fill below that level.
🔹Bearish Liquidity Sweep
These occur when price dips above a Buyside Liquidity (BSL) level, taking out the stop-loss orders placed by short seller traders above that high. The indicator marks a zone around the candle that swept the BSL to highlight where liquidity was removed from the market.
When this happens, it shows that the market just cleared out buyside liquidity, meaning short traders had their stops hit. This is often followed by a reversal or strong reaction downward, because the market no longer has pending liquidity to fill above that level.
Under the ‘Liquidity Sweeps’ section in the settings, you can toggle on/off Bullish Regular Sweeps and Bearish Regular Sweeps. You can also customize the line style and color of liquidity levels that have been swept.
🔹How to Use Liquidity Sweeps
Liquidity sweeps are not direct trade signals. They are best used as context when forming a directional bias. A sweep shows that the market has removed liquidity from one side, which can hint at where the next move may develop.
For example:
When Buyside Liquidity (BSL) is swept, it often signals that buy stops have been triggered and the market may be preparing to move lower. Traders may then begin looking for short opportunities.
When Sellside Liquidity (SSL) is swept, it often signals that sell stops have been triggered and the market may be preparing to move higher. Traders may then begin looking for long opportunities.
It’s common practice to use liquidity sweeps as the first step in building a trade idea. Many traders will wait for additional confirmation, such as a fair value gap forming after the sweep, before opening a position.
Under the ‘Liquidity Sweeps’ section in the settings, you can toggle on/off:
Bullish Regular Sweeps - when disabled, Bullish Regular Sweeps won’t appear on your chart.
Bearish Regular Sweeps - when disabled, Bearish Regular Sweeps won’t appear on your chart.
4️⃣Fair Value Gap Sweeps:
The indicator automatically detects bullish and bearish Fair Value Gap sweeps (FVG Sweep) using the liquidity levels you have enabled.
🔹What is a FVG Sweep?
A FVG Sweep is a specific type of liquidity sweep that not only clears liquidity above or below a key level, but also forms a Fair Value Gap (FVG) immediately afterward.
The liquidity sweep shows where stop orders were triggered, areas where the market aggressively took out one side’s liquidity. The formation of a Fair Value Gap right after the sweep confirms that displacement followed. This means that the sweep was not just a stop hunt, but a deliberate move backed by momentum.
In simple terms, a regular liquidity sweep only tells you that liquidity was taken. A FVG Sweep tells you that liquidity was taken and a strong directional move started immediately after, leaving an imbalance in price. That imbalance represents where aggressive buyers or sellers entered the market without enough opposite-side orders to keep price balanced. This combination adds a confirmation and intent behind regular liquidity sweeps.
🔹Bullish FVG Sweep
The indicator automatically detects bullish FVG Sweeps when price takes out a Sellside Liquidity (SSL) level and then forms a bullish FVG within the next few candles. This sequence shows that sellers were stopped out and buyers immediately entered the market with momentum.
🔹Bearish FVG Sweep
The indicator automatically detects bearish FVG Sweeps when price takes out a Buyside Liquidity (BSL) level and then forms a bearish FVG shortly after. This shows that short sellers’ stops were triggered, and new selling pressure entered the market right away.
🔹How to Use FVG Sweeps
Unlike regular liquidity sweeps, FVG Sweeps can be used as trade entries because they confirm both liquidity being cleared and immediate momentum. A regular sweep only shows that stop-losses were triggered, but an FVG Sweep proves that price not only cleared liquidity but also moved away with momentum, leaving behind an imbalance (Fair Value Gap). This shift often marks the start of a new short-term trend.
We’ll cover this in more detail in the Buy and Sell Signal section below, but in short, a bullish FVG Sweep can act as confirmation for a potential long entry after price takes out a low, while a bearish FVG Sweep can confirm a short entry after price takes out a high.
The strongest FVG Sweeps come from extremely sharp reversals. On the chart, they look like a “V” shape for bullish setups or an inverted “V” shape for bearish setups. This shape shows how quickly momentum shifted after liquidity was cleared. When price instantly reverses and leaves a Fair Value Gap behind, it’s a clear sign that buyers or sellers stepped in aggressively and absorbed all available liquidity on the opposite side.
In practice, traders often use FVG Sweeps as a trigger to align their bias. For example, after a bullish FVG Sweep, the focus shifts toward looking for long setups within the new imbalance or during a small retracement into the Fair Value Gap. After a bearish FVG Sweep, traders focus on short setups as price retraces back into the gap before continuing lower. The key takeaway is that FVG Sweeps show conviction.
Under the ‘Liquidity Sweeps’ section in the settings, you can toggle on/off:
Bullish FVG Sweeps - when disabled, Bullish FVG Sweeps won’t appear on your chart.
Bearish FVG Sweeps - when disabled, Bearish FVG Sweeps won’t appear on your chart.
Please Note: the settings you choose to use for Fair Value Gaps, under the ‘Fair Value Gaps’ section, will be used for FVG Sweeps. This is important because if you increase the sensitivity value for FVGs, not all FVG Sweeps will appear if the FVG’s size doesn’t meet the sensitivity threshold.
5️⃣Buy & Sell Signals:
This indicator also plots Buy & Sell signals. These signals follow logic based on Atif Hussain’s FVG trading model. The entry requirements for a Long & Short signal are outlined below.
🔹Buy Signal:
In order for a Buy Signal to generate, the following conditions must occur in order:
Bullish FVG Sweep
Price Retraces to the Bullish FVG
🔹Sell Signal:
In order for a Buy Signal to generate, the following conditions must occur in order:
Bearish FVG Sweep
Price Retraces to the FVG
🔹Require Retracement:
Under the ‘Signals’ section in the settings, you can toggle on/off the ‘Require Retracement’ setting. When disabled, a long/short signal will appear immediately after a Bullish or Bearish FVG Sweep, instead of waiting for price to retrace back to the gap.
Please Note: the liquidity levels you enable under the ‘Liquidity Levels’ section will be the levels used for signals. Thus, if you only have the Previous Day Highs/Lows enabled, then only those levels will be used to generate buy/sell signals. Also, long Signals will only appear if Bullish FVG Sweeps are enabled, and Short Signals will only appear if Bearish FVG Sweeps are enabled.
When a Buy Signal or Sell Signal is plotted, three suggested take-profit levels and one suggested stop-loss level are plotted. There are two different Take-Profit methods you can choose from within the indicator settings: Manual or Auto.
🔹Manual Take-Profit:
If you’re using manual take-profit levels, you can customize the Risk-to-Reward (RR) for Take-Profit 1, 2, and 3 by adjusting the “RR 1”, “RR 2”, and “RR 3” settings. Setting RR 1 to 1 means take-profit 1 is a 1:1 risk-to-reward ratio. The stop-loss will always be placed at the recent low for Buy Signals, and at the recent high for Sell Signals.
🔹Auto Take-Profit:
If you select to use Auto Take-Profit instead of Manual, then Take-Profit 1, 2, and 3 will be automatically determined based on nearby liquidity levels. The stop-loss will be placed at the recent low for Buy Signals, and at the recent high for Sell Signals. Take-Profit Levels 1, 2, and 3 will be placed at the three closest opposite liquidity levels. If the take-profit 2 and take-profit 3 levels are too far away, only one take-profit level will be displayed.
🔹Signal Settings:
Long Signals:
When enabled, long signals are shown. When disabled, long signals will not appear.
Short Signals:
When enabled, short signals are shown. When disabled, short signals will not appear.
Require Retracement:
When enabled, price must retrace to a FVG after a FVG Sweep in order for a signal to be generated.
Take-Profit Levels:
When enabled, take-profit levels (TP 1, TP 2, and TP 3) are shown with long/short signals. When disabled, take-profit levels and their price labels are not displayed.
Take-Profit Labels:
When enabled, take-profit labels are displayed when price reaches one of the three take-profit levels. When disabled, labels won’t appear when price reaches take-profit levels.
Stop-Loss Levels:
When enabled, stop-loss levels are shown for long/short signals. When disabled, the stop-loss level and its price label are not displayed.
Stop-Loss Labels:
When enabled, stop-loss levels are shown for long/short signals. When disabled, a label won’t appear when price reaches the stop-loss level.
6️⃣Alerts:
The indicator supports alerts, so you never miss a key market move. You can choose to receive alerts for each of the following conditions:
Bearish Liquidity Sweep
Bullish Liquidity Sweep
Bearish FVG Sweep
Bullish FVG Sweep
Long Signal
Short Signal
TP 1
TP 2
TP 3
Stop-Loss
‼️Important Notes:
TradingView has limitations when running features on multiple timeframes, such as the liquidity levels, which can result in the following error:
🔹Computation Error:
The computation of using MTF features are very intensive on TradingView. This can sometimes cause calculation timeouts. When this occurs, simply force the recalculation by modifying one indicator’s settings or by removing the indicator and adding it to your chart again.
🚩 UNIQUENESS:
This indicator is unique because it identifies a specific type of liquidity event referred to as FVG Sweeps, where price takes liquidity and then immediately forms a Fair Value Gap in the opposite direction. These FVG Sweeps serve as the foundation of the model, and the script uses them as the required condition for generating Buy and Sell signals. Once an FVG Sweep is confirmed, the indicator automatically produces a fully defined trade idea with a stop-loss and up to three take-profit targets, following a consistent rule-based execution approach.

NY Reversal Pattern StatsThe NY Reversal Pattern Stats indicator is a tool for identifying and analyzing specific price action patterns that occur during the New York trading session. Its goal is to highlight potential reversal or continuation opportunities that may arise from market manipulation or shifts in volatility within this key market window. Beyond simply identifying patterns, the indicator provides valuable historical statistics on their performance, helping traders evaluate their effectiveness.
Key Features
New York Session Highlighting: Clearly visualizes the defined New York trading session directly on your chart.
Automated Pattern Detection: Automatically detects two types of patterns within the New York session:
Manipulation Wick: Identifies instances where price attempts to push significantly beyond a recent session extreme but is rejected, resulting in a wick with the close returning to the original side.
Low Volatility Reversal: Detects price interaction with a recent session extreme where the resulting candle shows lower-than-average volatility, suggesting potential exhaustion or a reversal point.
Pattern Confirmation Tracking: Tracks whether a detected pattern leads to a follow-through move based on a defined confirmation rule (currently, price returning to the session midpoint).
Comprehensive Statistics Table: Displays a detailed table on the chart summarizing:
Total patterns observed.
Number of patterns that were confirmed.
Success and failure rates.
Maximum losing streak.
Statistical relevance metrics (Sigma, Z-Score, P-value) to help assess if the observed success rate is likely due to chance.
A clear description interpreting the statistical relevance and pattern performance (more often right/wrong).
Customizable Visuals: Allows users to control the appearance of the session background and pattern labels.
Alerts: Provides options to set alerts when a new pattern is detected or when a detected pattern is confirmed.
How to Use the Indicator
Add to Chart: Apply the "NY Reversal Pattern Stats" indicator to your desired chart in TradingView.
Configure Inputs: Open the indicator's settings to customize the parameters:
Session Time Definition: Set the exact start hour, minute, and duration (in hours) for the New York session you wish to analyze. Use the "NY Time" inputs (e.g., 6:00 AM - 10:00 AM for Indices, 5:00 AM - 9:00 AM for Forex). The indicator uses the "America/New_York" timezone to handle Daylight Saving Time.
NY Session Visuals: Choose whether to display the session background and pattern labels, and customize their colors.
Pattern Detection: Adjust the sensitivity of the Manipulation Wick threshold and configure the settings for the Low Volatility Reversal pattern detection (enable/disable, ATR length, volatility factor).
Confirmation: Enable or disable the session midpoint confirmation criterion.
Show Statistics Table: Toggle the visibility of the statistics table.
Interpret the Chart: Observe the highlighted New York session windows and the labels indicating detected and confirmed patterns.
Analyze the Statistics Table: Refer to the statistics table for historical performance data.
Total Patterns: Indicates the sample size. More patterns generally lead to more statistically reliable results.
Confirmed/Failed: Shows the raw counts of successful and unsuccessful patterns based on the confirmation rule.
Success/Fail Rate (%): Provides the percentage of patterns that met or did not meet the confirmation criterion.
Statistical Relevance: Read the description provided in the table. It interprets the Z-Score and sample size to tell you if the observed success rate is statistically significant (i.e., unlikely to be just random chance).
Pattern Performance: Read the description indicating whether the pattern has historically been "More often right than wrong" or "More often wrong than right" based on the success rate.
Sigma / Z-Score / P-value: These are standard statistical measures. A higher absolute Z-Score and a lower P-value (especially below 0.05 or 0.01) suggest stronger statistical evidence that the pattern's success rate is different from a random 50/50 outcome.
Set Alerts: If desired, configure alerts to be notified when patterns are detected or confirmed, allowing you to potentially take action in real-time.
Interpretation of Results
High Success Rate + High Statistical Relevance: This combination suggests the detected pattern, as defined and confirmed by the indicator, has historically shown a consistent edge within the specified New York session window, and this performance is unlikely due to random chance.
High Success Rate + Low Statistical Relevance: The pattern has performed well in the observed data, but the sample size might be too small for high confidence that this performance will continue.
Low Success Rate + High Statistical Relevance: The pattern, as defined, has historically shown a tendency to fail more often than succeed, and this underperformance is statistically significant.
Low Statistical Relevance (Regardless of Success Rate): The sample size is insufficient to draw strong conclusions about the pattern's effectiveness. More historical data is needed.
Remember that past performance is not indicative of future results. Statistical analysis provides insights into historical tendencies, but trading decisions should always involve a comprehensive analysis and risk management plan.
Limitations
Timeframe Dependency: The pattern detection and session high/low accumulation operate on the chart's current timeframe. It does not specifically analyze only the 4-hour candles as might be implied by "4H Candle Profiling Patterns".
Confirmation Criterion: The confirmation rule is fixed to price returning to the session midpoint. If your strategy uses a different confirmation or target, this indicator's statistics may not directly reflect its performance.
No London/Asia Filter: The indicator does not check the performance or characteristics of the London or Asia sessions to filter for instances where "London and Asia Fail".
Potential Timezone Compiler Issues: While the code uses standard v6 timezone handling, some specific TradingView environments may exhibit unexpected behavior with timezone strings, potentially affecting the precise timing of the session boundaries.
This indicator is a powerful tool for analyzing specific price action patterns during the New York session. By understanding its inputs, outputs, and limitations, traders can gain valuable insights into potential trading opportunities.
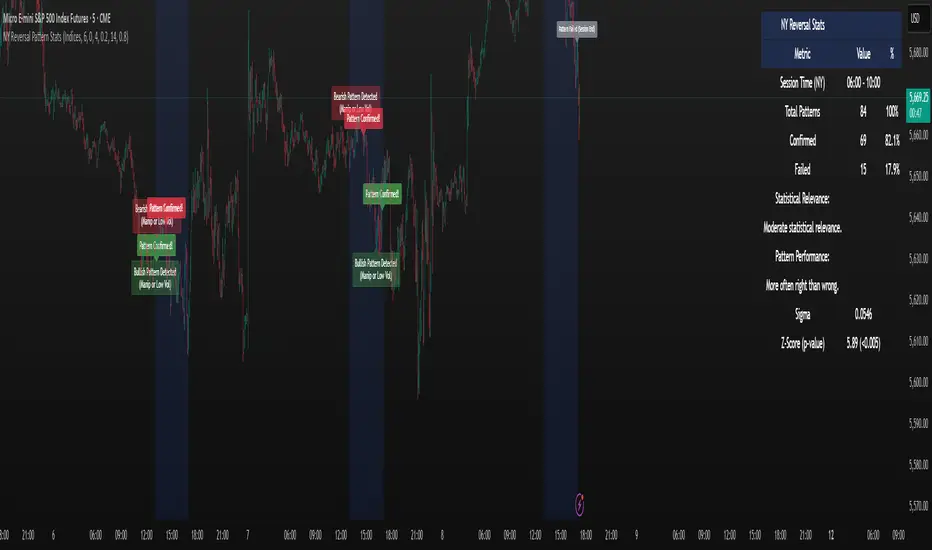
ZenAlgo - SessionsZenAlgo - Sessions is a robust TradingView indicator designed to analyze and visualize global trading sessions (Asian, European, and US). By combining session-specific price levels, volume and delta tracking, and historical performance metrics, it delivers actionable insights for session-based trading strategies, simplifying decision-making in dynamic markets.
Features
Session Highlighting: Distinguishes trading sessions with customizable colors for easy identification.
Session Levels: Dynamically calculates and projects five key levels (0%, 25%, 50%, 75%, 100%) to identify support and resistance zones.
Volume and Delta Tracking: Tracks session-specific total volume, inflows, outflows, and delta to assess market sentiment.
Interactive Performance Table: Summarizes recent session metrics, including win/loss percentages, volume, and delta, enabling trend analysis.
Historical Analysis: Retains session performance data for up to 100 sessions, providing insights into long-term trends.
Dynamic Range Projection: Extends session levels into subsequent sessions, maintaining market context.
Customizable Time Zones: Adapts session tracking to any trading environment.
Added Value: Why Is This Indicator Original/Why Shall You Pay for This Indicator?
1. Synergy Between Indicators
Session Levels: Highlight key market zones that guide entry/exit points.
Volume and Delta Metrics: Clarify price action at these levels by identifying buyer/seller dominance.
Performance Metrics: Aggregate historical session data, helping traders identify recurring patterns, sentiment shifts, and session-specific tendencies.
Together, these features amplify one another, creating actionable insights that exceed the value of standalone tools.
2. Comparison to Freely Available Indicators
Traditional indicators like Bollinger Bands, RSI, or Moving Averages operate on broad price action trends. ZenAlgo - Sessions focuses on session-specific patterns, volume dynamics, and real-time updates, delivering more context-specific insights.
By consolidating multiple functionalities into one tool, it eliminates the need for multiple separate indicators, streamlining analysis.
3. Why Pay for This Indicator?
Comprehensive Insights: Delivers session-specific metrics unavailable in standalone tools.
Real-Time Updates: Ensures metrics and levels reflect the latest market movements.
Seamless Integration: Combines price action, volume, and historical performance into a single, intuitive interface.
How It Works
1. Session Detection
Defines sessions for Asia, Europe, and the US based on fixed opening and closing times. Time zones ensure compatibility with global markets, excluding weekends and holidays for relevance.
2. Price Levels
Calculates five levels (0%, 25%, 50%, 75%, 100%) based on session high and low, projecting these into subsequent sessions for continued analysis.
3. Volume and Delta Metrics
Tracks session volume, separating inflows and outflows based on price movements.
Calculates delta to gauge net buying/selling activity.
4. Performance Metrics
Tracks win/loss rates and percentage changes across sessions.
Stores session metrics (volume, delta, win/loss) for up to 100 sessions.
5. Dynamic Visualization
Continuously updates session levels and metrics in real time for actionable insights.
Usage Examples
Support/Resistance Levels: Use session levels, especially the 50% midline, as potential pivot points for trades.
Breakout Analysis: Monitor price action beyond session highs or lows to confirm breakouts.
Volume Trends: Compare session volumes to identify high-activity periods.
Delta Shifts: Assess delta changes to determine market sentiment at key levels.
Session Comparison: Identify which session drives significant activity using the performance table.
Multi-Session Strategies: Plan trades based on extended session levels to anticipate reactions at previously tested zones.
Settings
Asia Session Color: Adjust the highlight color for the Asian session.
Europe Session Color: Customize the color for the European session.
US Session Color: Define the color for the US session.
Time Zone: Set the time zone for session tracking.
Line Transparency: Adjust session line opacity.
Number of Sessions for Total Count: Define how many sessions to analyze in the performance table.
Important Notes
This indicator is a technical analysis tool and does not guarantee trading success. Use it alongside other indicators and fundamental analysis for a comprehensive trading strategy.
Combine with Other Tools: Use complementary indicators such as RSI, Bollinger Bands, or ATR to filter out unreliable signals and improve accuracy.
Known Weaknesses and Mitigation Strategies
1. Extreme Volatility
Issue: During sudden, significant price movements (e.g., news-driven events), session levels and delta metrics may become less reliable as the market temporarily disregards historical patterns.
Mitigation: Combine ZenAlgo - Sessions with volatility indicators like ATR (Average True Range) or a news alert system to adjust expectations during these periods.
2. Low Liquidity Periods
Issue: During holidays or outside peak trading hours, session metrics may misrepresent actual market activity due to reduced participant involvement.
Mitigation: Focus on sessions with higher activity (e.g., overlapping US and European sessions) to ensure more accurate insights.
3. Non-Standard Trading Hours
Issue: Market-specific differences, such as extended hours or daylight saving adjustments, can misalign session boundaries.
Mitigation: Verify session times align with your market and adjust settings accordingly.
4. Historical Data Dependencies
Issue: Historical metrics rely on consistent session patterns; deviations (e.g., extended or shortened sessions) can impact trend accuracy.
Mitigation: Regularly review and interpret historical data alongside real-time metrics to ensure alignment.

Enhanced London Session SMC SetupEnhanced London Session SMC Setup Indicator
This Pine Script-based indicator is designed for traders focusing on the London trading session, leveraging smart money concepts (SMC) to identify potential trading opportunities in the GBP/USD currency pair. The script uses multiple techniques such as Order Block Detection, Imbalance (Fair Value Gap) Analysis, Change of Character (CHoCH) detection, and Fibonacci retracement levels to aid in market structure analysis, providing a well-rounded approach to trade setups.
Features:
London Session Highlight:
The indicator visually marks the London trading session (from 08:00 AM to 04:00 PM UTC) on the chart using a blue background, signaling when the high-volume, high-impulse moves tend to occur, helping traders focus their analysis on this key session.
Order Block Detection:
Identifies significant impulse moves that may form order blocks (supply and demand zones). Order blocks are areas where institutions have executed large orders, often leading to price reversals or continuation. The indicator plots the high and low of these order blocks, providing key levels to monitor for potential entries.
Imbalance (Fair Value Gap) Detection:
Detects and highlights price imbalances or fair value gaps (FVG) where the market has moved too quickly, creating a gap in price action. These areas are often revisited by price, offering potential trade opportunities. The upper and lower bounds of the imbalance are visually marked for easy reference.
Change of Character (CHoCH) Detection:
This feature identifies potential trend reversals by detecting significant changes in market character. When the price action shifts from bullish to bearish or vice versa, a CHoCH signal is triggered, and the corresponding level is marked on the chart. This can help traders catch trend reversals at key levels.
Fibonacci Retracement Levels:
The script calculates and plots the key Fibonacci retracement levels (0.618 and 0.786 by default) based on the highest and lowest points over a user-defined swing lookback period. These levels are commonly used by traders to identify potential pullback zones where price may reverse or find support/resistance.
Directional Bias Based on Market Structure:
The indicator provides a market structure analysis by comparing the current highs and lows to the previous periods' highs and lows. This helps in identifying whether the market is in a bullish or bearish state, providing a clear directional bias for trade setups.
Alerts:
The indicator comes with built-in alert conditions to notify the trader when an order block, imbalance, CHoCH, or other significant price action event is detected, ensuring timely action can be taken.
Ideal Usage:
Timeframe: Suitable for intraday trading, particularly focusing on the London session (08:00 AM to 04:00 PM UTC).
Currency Pair: Specifically designed for GBP/USD but can be adapted to other pairs with similar market behavior.
Trading Strategy: Best used in conjunction with a price action strategy, focusing on the key levels identified (order blocks, FVG, CHoCH) and using Fibonacci retracement levels for precision entries.
Target Audience: Ideal for traders who follow smart money concepts (SMC) and are looking for a structured approach to identify high-probability setups during the London session.

Session MasterSession Master Indicator
Overview
The "Session Master" indicator is a unique tool designed to enhance trading decisions by providing visual cues and relevant information during the critical last 15 minutes of a trading session. It also integrates advanced trend analysis using the Average Directional Index (ADX) and Directional Movement Index (DI) to offer insights into market trends and potential entry/exit points.
Originality and Functionality
This script combines session timing, visual alerts, and trend analysis in a cohesive manner to give traders a comprehensive view of market behavior as the trading day concludes. Here’s a breakdown of its key features:
Last 15 Minutes Highlight : The script identifies the last 15 minutes of the trading session and highlights this period with a semi-transparent blue background, helping traders focus on end-of-day price movements.
Previous Session High and Low : The script dynamically plots the high and low of the previous trading session. These levels are crucial for identifying support and resistance and are highlighted with dashed lines and labeled for easy identification during the last 15 minutes of the current session.
Directional Movement and Trend Analysis : Using a combination of ADX and DI, the script calculates and plots trend strength and direction. A 21-period Exponential Moving Average (EMA) is plotted with color coding (green for bullish and red for bearish) based on the DI difference, offering clear visual cues about the market trend.
Technical Explanation
Last 15 Minutes Highlight:
The script checks the current time and compares it to the session’s last 15 minutes.
If within this period, the background color is changed to a semi-transparent blue to alert the trader.
Previous Session High and Low:
The script retrieves the high and low of the previous daily session.
During the last 15 minutes of the session, these levels are plotted as dashed lines and labeled appropriately.
ADX and DI Calculation:
The script calculates the True Range, Directional Movement (both positive and negative), and smoothes these values over a specified length (28 periods by default).
It then computes the Directional Indicators (DI+ and DI-) and the ADX to gauge trend strength.
The 21-period EMA is plotted with dynamic color changes based on the DI difference to indicate trend direction.
How to Use
Highlight Key Moments: Use the blue background highlight to concentrate on market movements in the critical last 15 minutes of the trading session.
Identify Key Levels: Pay attention to the plotted high and low of the previous session as they often act as significant support and resistance levels.
Assess Trend Strength: Use the ADX and DI values to understand the strength and direction of the market trend, aiding in making informed trading decisions.
EMA for Entry/Exit: Use the color-coded 21-period EMA for potential entry and exit signals based on the trend direction indicated by the DI.
Conclusion
The "Session Master" indicator is a powerful tool designed to help traders make informed decisions during the crucial end-of-session period. By combining session timing, previous session levels, and advanced trend analysis, it provides a comprehensive overview that is both informative and actionable. This script is particularly useful for intraday traders looking to optimize their strategies around session close times.

MSSM - Multi-Session Structural Map (Precision Sweeps)MSSM – Multi-Session Structural Map (Precision Sweeps)
This indicator provides a structured view of the market based on four key components:
1). Previous session levels
2). Confirmed fractal swing points
3). Volume pocket highlights
4). Non-repainting precision liquidity sweep markers
It is designed to help analyze how price interacts with important reference areas and structural points. This tool does not generate signals or predictions. All information is visual and educational only.
HOW THE INDICATOR WORKS
PREVIOUS SESSION LEVELS
The script plots the previous session’s High, Low, and Mid. These levels help observe how the current session behaves around the prior day’s range. They act as reference areas only.
FRACTAL SWING MAP (NON-REPAINTING)
Confirmed fractals are used to mark historical swing highs and swing lows. Since fractals confirm after a certain number of bars, the swings do not repaint once formed. These swings provide a clearer view of market structure.
VOLUME POCKETS
The indicator highlights areas where volume expands relative to a rolling volume average. These regions show increased participation or activity. The highlights are informational and do not imply direction.
PRECISION LIQUIDITY SWEEPS (NON-REPAINTING)
A sweep is tagged only when:
• Price trades beyond a confirmed swing high or swing low
• Price closes back inside the previous swing level
• A wick rejection occurs
• Volume expands relative to a recent rolling average
These markers simply show where price interacted with liquidity around prior structural levels. They do not indicate a trading signal or bias.
HOW TO ADD THE INDICATOR
Open the Pine Editor in TradingView
Search the indicator name and add to favorites.
Click “Add to chart”
Adjust settings as needed (fractals, sweeps, volume pockets, or session levels)
HOW TO READ AND USE THE INDICATOR
SESSION LEVELS
Observe whether price respects, rejects, compresses around, or expands beyond the previous session high, low, or midpoint. These are observational reference levels only.
FRACTALS
Fractal highs and lows help visualize structural turning points. They provide a clearer picture of where liquidity may rest above or below past swing levels.
VOLUME POCKETS
When volume expands compared to the recent average, the candle is shaded. These areas may show increased participation, but no directional meaning is implied.
PRECISION SWEEPS
Sweeps highlight when price reaches beyond a prior confirmed swing level and then rejects that area with displacement. These markers identify interactions with liquidity, but they are not signals and do not forecast future outcomes.
CUSTOMIZATION OPTIONS
Users can adjust:
• Session level visibility
• Fractal sensitivity
• Volume pocket threshold
• Sweep sensitivity and visibility
• Transparency and styling
This makes the tool flexible across different symbols and timeframes.
IMPORTANT NOTES AND POLICY COMPLIANCE
• The indicator does not provide buy or sell signals
• The indicator does not predict price or direction
• All plotted elements are based on past price behavior
• All components are informational only
• Users should perform their own analysis and risk evaluation
• Past behavior does not guarantee future performance
SUMMARY
MSSM provides a structured view of price by combining previous session levels, confirmed swing structure, volume expansion zones, and non-repainting sweep identification. Its purpose is to assist traders in visually analyzing market structure while staying fully aligned with TradingView’s House Rules and content policies.

Liquidity Sweep & FVG StrategyThis strategy combines higher-timeframe liquidity levels, stop-hunt (sweep) logic, Fair Value Gaps (FVGs) and structure-based take-profits into a single execution engine.
It is not a simple mash-up of indicators: every module (HTF levels, sweeps, FVGs, ZigZag, sessions) feeds the same entry/exit logic.
1. Core Idea
The script looks for situations where price:
Sweeps a higher-timeframe high/low (takes liquidity around obvious levels),
Then forms a displacement candle with a gap (FVG) in the opposite direction,
Then uses the edge of that FVG as a limit entry,
And manages exits using unswept structural levels (ZigZag swings or HTF levels) as targets.
The intent is to systematically trade failed breakouts / stop hunts with a defined structure and risk model.
It is a backtesting / study tool, not a signal service.
2. How the Logic Works (Conceptual)
a) Higher-Timeframe Liquidity Engine
Daily, Weekly and Monthly highs/lows are pulled via request.security() and stored as HTF liquidity levels.
Each level is drawn as a line with optional label (1D/1W/1M High/Low).
A level is marked as “swept” once price trades through it; swept levels may be removed or shortened depending on settings.
b) Sweep & Manipulation Filter
A low sweep occurs when the current low trades through a stored HTF low.
A high sweep occurs when the current high trades through a stored HTF high.
If both a high and a low are swept in the same bar, the script flags this as “manipulation” and blocks new entries around that noise.
The script also tracks the sweep wick, bar index and HTF timeframe for later use in SL placement and labels.
c) FVG Detection & Management
FVGs are defined using a 3-candle displacement model:
Bullish FVG: high < low
Bearish FVG: low > high
Only gaps larger than a minimum size (ATR-based if no manual value is set) are kept.
FVGs are stored in arrays as boxes with: top, bottom, mid (CE), direction, and state (filled / reclaimed).
Boxes are auto-extended and visually faded when price is far away, or deleted when filled.
d) Entry Conditions (Sweep + FVG)
For each recent sweep window:
After a low sweep, the script searches for the nearest bullish FVG below price and uses its top edge as a long limit entry.
After a high sweep, it searches for the nearest bearish FVG above price and uses its bottom edge as a short limit entry.
A “knife protection” check blocks trades where price is already trading through the proposed stop.
Only one entry per sweep is allowed; entries are only placed inside the configured NY trading sessions and only if no manipulation flag is active and EOD protection allows it.
e) Stop-Loss Placement (“Tick-Free” SL)
The stop is not placed directly on the HTF level; instead, the script scans a window around the sweep bar to find a local extreme:
Longs: lowest low in a configurable bar window around the sweep.
Shorts: highest high in that window.
This produces a structure-based SL that is generally outside the main sweep wick.
f) Take-Profit Logic (ZigZag + HTF Levels)
A lightweight ZigZag engine tracks swing highs/lows and removes levels that have already been broken.
For intraday timeframes (< 1h), TP candidates come from unswept ZigZag swings above/below the entry.
For higher timeframes (≥ 1h), TP candidates fall back to unswept HTF liquidity levels.
The script picks up to two targets:
TP1: nearest valid target in the trade direction (or a 2R fallback if none exists),
TP2: second target (or a 4R fallback if none exists).
A multi-TP model is used: typically 50% at TP1, remainder managed towards TP2 with breakeven plus offset once TP1 is hit.
g) Session & End-of-Day Filters
Three predefined NY sessions (Early, Open, Afternoon) are available; entries are only allowed inside active sessions.
An End-of-Day filter checks a user-defined NY close time and:
Blocks new entries close to the end of the day,
Optionally forces flat before the close.
3. Inputs Overview (Conceptual)
Liquidity settings: which HTF levels to track (1D/1W/1M), how many to show, and sweep priority (highest TF vs nearest vs any).
FVG settings: visibility radius, search window after a sweep, minimum FVG size.
ZigZag settings: swing length used for TP discovery.
Execution & protection: limit order timeout, breakeven offset, EOD protection.
Visuals: labels, sweep markers, manipulation warning, session highlighting, TP lines, etc.
For exact meaning of each input, please refer to the inline comments in the open-source code.
4. Strategy Properties & Backtesting Notes
Default strategy properties in this script:
Initial capital: 100,000
Order size: 10% of equity (strategy.percent_of_equity)
Commission: 0.01% per trade (adjust as needed for your broker/asset)
Slippage: must be set manually in the Strategy Tester (recommended: at least a few ticks on fast markets).
Even though the order size is 10% of equity, actual risk per trade depends on the SL distance and is typically much lower than 10% of the account. You should still adjust these values to keep risk within what you personally consider sustainable (e.g. somewhere in the 1–2% range per trade).
For more meaningful results:
Test on liquid instruments (e.g. major indices, FX, or liquid futures).
Use enough history to reach 100+ closed trades on your market/timeframe.
Always include realistic commission and slippage.
Do not assume that past performance will continue.
5. How to Use
Apply the strategy to your preferred symbol and timeframe.
Set broker-like commission and slippage in the Strategy Tester.
Adjust:
HTF levels (1D/1W/1M),
Sessions (NY windows),
FVG search window and minimum size,
ZigZag length and EOD filter.
Observe how entries only appear:
After a HTF sweep,
In the configured session,
At a FVG edge,
With TP lines anchored at unswept structure / liquidity.
Use this primarily as a research and backtesting tool to study how your own ICT / SMC ideas behave over a large sample of trades.
6. Disclaimer
This script is for educational and research purposes only.
It does not constitute financial advice, and it does not guarantee profitability. Always validate results with realistic assumptions and use your own judgment before trading live.

🎓 Smart Beginner Pro - AI Trading Assistant🎓 Smart Beginner Pro - AI Trading Assistant
Short Description:
Your perfect FIRST trading indicator! Clear BUY/SELL signals with automatic risk management. Learn professional trading while getting 5-star rated entries. Built-in education + Stop Loss/Take Profit included. No experience needed!
🎯 FULL DESCRIPTION
Smart Beginner Pro is the ONLY indicator designed specifically to help complete beginners start trading professionally from day one!
Unlike complicated indicators that overwhelm you with information, Smart Beginner Pro makes trading simple while teaching you professional techniques.
🌟 What Makes This Special?
⭐ 5-Star Quality Rating System
Every signal is rated 1-5 stars based on:
✅ Trend alignment
✅ Major trend confirmation
✅ Volume analysis
✅ RSI health check
✅ Trend strength
You always know EXACTLY how good a setup is before entering!
Example:
⭐⭐⭐⭐⭐ = Perfect setup (all factors aligned)
⭐⭐⭐⭐ = Excellent setup (4/5 factors)
⭐⭐⭐ = Good setup (3/5 factors)
Choose your preferred quality level - Conservative traders only take 5-star signals!
🎓 Built-in Education
Learn WHILE You Trade!
This isn't just an indicator - it's your AI trading teacher!
Beginner Mode Features:
✅ Educational tooltips on every signal
✅ Explains WHY each signal appears
✅ Shows what each factor means
✅ Teaches you professional analysis
✅ Risk management guidance included
After a few weeks, you'll understand:
How trends work
Why volume matters
When to enter trades
How to manage risk
Professional trading concepts
Turn OFF Beginner Mode when ready for cleaner charts!
🛡️ Automatic Risk Management
Never Wonder Where to Place Stops Again!
Every signal comes with:
Entry Zone (Green box)
Exact entry price shown
Small buffer zone for entry
Stop Loss (Red box)
Calculated using ATR (volatility)
Placed at safe distance
Protects your capital
Take Profit 1 (Yellow box)
First profit target (50% of full target)
Partial profit recommended
Take Profit 2 (Green box)
Full profit target (1:3 risk/reward default)
Let winners run!
Risk/Reward Ratio: Always displayed!
Default: 1:3 (Risk $10 to make $30)
Customizable: 1.5 to 5.0
Professional money management built-in
🎯 Crystal Clear Signals
No Confusion. No Guessing.
BUY Signals:
🟢 HUGE green arrow below bar
Text says "BUY"
Star rating above
Can't miss it!
SELL Signals:
🔴 HUGE red arrow above bar
Text says "SELL"
Star rating below
Impossible to miss!
WAIT (No Signal):
⚪ Dashboard shows "WAIT"
Don't trade when no signal
Patience is key!
📊 Live Dashboard
All Information at a Glance:
Everything you need to make a decision - RIGHT THERE!
⚙️ Three Sensitivity Modes
Choose your trading style:
🎯 Conservative (Recommended for Beginners)
✅ Only 5-star signals
✅ 2-3 signals per day
✅ Highest win rate
✅ Best for learning
✅ Perfect for part-time traders
⚖️ Balanced (Default)
✅ 4-5 star signals
✅ 5-8 signals per day
✅ Good win rate
✅ More opportunities
✅ Best for most traders
⚡ Aggressive (For Active Traders)
✅ 3-5 star signals
✅ 10-15 signals per day
✅ More trades
✅ Requires experience
✅ For full-time traders
Start Conservative → Move to Balanced → Then Aggressive as you improve!
🌍 Works on EVERYTHING
✅ All Markets:
Forex (EUR/USD, GBP/USD, etc.)
Crypto (Bitcoin, Ethereum, etc.)
Stocks (Apple, Tesla, etc.)
Indices (S&P 500, NASDAQ, etc.)
Commodities (Gold, Silver, Oil, etc.)
✅ All Timeframes:
M5-M15: Scalping (quick trades)
M15-H1: Day trading (same day)
H4-D1: Swing trading (multi-day)
One indicator for your entire trading career!
🕐 Session Highlighting
Trade at the Right Time!
Background colors show best trading sessions:
🟢 Green = London Session (8 AM - 4 PM GMT)
High liquidity
Best for EUR/GBP pairs
🔵 Blue = New York Session (1 PM - 9 PM GMT)
Maximum liquidity
Best for all USD pairs
No color = Asian Session
Lower liquidity
Beginners: Avoid or trade carefully
Toggle ON/OFF in settings if you don't need it.
📚 How to Use (Step by Step)
For Complete Beginners:
Step 1: Add to Chart
1. Open your favorite pair (Start with EUR/USD)
2. Set timeframe to M15
3. Add "Smart Beginner Pro" indicator
4. Done! Default settings work great!
Step 2: Wait for Signal
1. Watch the dashboard
2. When it says "BUY" or "SELL" → A signal appeared!
3. Check the star rating (aim for 4-5 stars)
4. Look at "Safe to Trade" (should be ✅ YES)
Step 3: Enter Trade
1. Enter at current market price
2. Set Stop Loss at RED box level
3. Set Take Profit at GREEN box level (TP2)
4. Optional: Take partial profit at YELLOW box (TP1)
Step 4: Manage Trade
1. Let the trade run to TP or SL
2. Don't move stops (trust the system)
3. When TP1 hit: Close 50%, let rest run
4. When TP2 hit or SL hit: Close completely
Step 5: Learn & Improve
1. Review what happened
2. Was it a 5-star? How did it perform?
3. Read the tooltips (Beginner Mode)
4. Understand WHY signals work
5. Get better with each trade!
💡 Trading Rules for Success
🟢 DO:
✅ Only trade 4-5 star signals at first
✅ Use proper position sizing (1-2% risk)
✅ Always set Stop Loss (use indicator levels)
✅ Be patient (wait for quality setups)
✅ Trade during good sessions (London/NY)
✅ Learn from each trade
✅ Keep a trading journal
🔴 DON'T:
❌ Trade 1-2 star signals (not shown anyway)
❌ Risk more than 2% per trade
❌ Move stop losses (honor them!)
❌ Trade without a signal
❌ Overtrade (quality > quantity)
❌ Trade when "Safe to Trade" says NO
❌ Trade on emotion
⚙️ Settings Explained
📊 Mode Settings
Beginner Mode (Default: ON)
What it does:
- Shows educational tooltips
- Displays "Why?" explanations
- Extra help text
- Star ratings always visible
Turn OFF when:
- You understand the signals
- Want cleaner charts
- Prefer minimal interface
Signal Sensitivity
Conservative: Only perfect setups (5 stars)
Balanced: Good setups (4-5 stars)
Aggressive: Okay setups (3-5 stars)
Tip: Start Conservative, upgrade as you improve!
📈 Trend Settings
Fast EMA (Default: 9)
Shorter period = More responsive
Longer period = Smoother trend
Recommended: Keep at 9
Slow EMA (Default: 21)
Used with Fast EMA for crossovers
Recommended: Keep at 21
Standard setting works best
Major Trend EMA (Default: 200)
The "big picture" trend
Above = Uptrend | Below = Downtrend
Never trade against this!
Recommended: Keep at 200
Show EMAs (Default: ON)
Toggle if you want cleaner chart
EMAs still calculated even if hidden
Dashboard still shows trend direction
🛡️ Risk Management
Risk/Reward Ratio (Default: 3.0)
How much profit vs risk
3.0 = Risk $10 to make $30
Conservative: 2.0
Balanced: 3.0
Aggressive: 4.0-5.0
Higher = Bigger targets (but fewer hits)
Stop Loss ATR Multiplier (Default: 1.5)
How far stop loss is placed
Based on volatility (ATR)
Tight: 1.0 (more stops hit)
Balanced: 1.5
Loose: 2.0-3.0 (fewer stops, bigger risk)
Show Entry/SL/TP Boxes (Default: ON)
Toggle the colored risk boxes
Keep ON for visual guidance
Turn OFF for minimal charts
🎨 Visual Settings
Highlight Trading Sessions (Default: ON)
Shows London/NY sessions with color
Helps you trade at best times
Turn OFF if you trade 24/7
Show Trend Strength Bar (Default: ON)
Shows trend strength percentage
Useful for filtering weak trends
Turn OFF if not needed
🎓 Educational Value
What You'll Learn:
Week 1-2: Basics
✅ How to read trend direction
✅ When to enter trades
✅ Where to place stop losses
✅ What risk/reward means
✅ Why some signals are better than others
Week 3-4: Intermediate
✅ How EMA crossovers work
✅ Why volume matters
✅ What RSI tells you
✅ Session timing importance
✅ Risk management principles
Month 2-3: Advanced
✅ Market structure understanding
✅ Trend vs range recognition
✅ Quality signal identification
✅ Position sizing strategies
✅ Trading psychology basics
After 3 Months:
🎯 You're no longer a beginner!
🎯 You understand price action
🎯 You can analyze markets yourself
🎯 You make informed decisions
🎯 Ready for advanced indicators
💎 Why Choose Smart Beginner Pro?
vs. Other Beginner Indicators:
Most Beginner Indicators:
❌ Just show arrows (no explanation)
❌ No quality rating
❌ No stop loss help
❌ No education
❌ Too many bad signals
❌ Confusing settings
Smart Beginner Pro:
✅ Explains WHY each signal
✅ 5-star quality system
✅ Automatic SL/TP levels
✅ Built-in education
✅ Quality over quantity
✅ Simple, clear settings
✅ Professional results from day 1
vs. Advanced Indicators:
Advanced Indicators:
❌ Too complicated for beginners
❌ Require trading knowledge
❌ No educational features
❌ Overwhelming settings
❌ Steep learning curve
Smart Beginner Pro:
✅ Simple but powerful
✅ No prior knowledge needed
✅ Teaches while you trade
✅ Easy to understand
✅ Grows with you
🚀 Quick Start Guide
First 24 Hours:
Hour 1: Setup
1. Add indicator to EUR/USD M15
2. Enable all alerts (BUY + SELL)
3. Read dashboard labels
4. Wait for first signal
Hour 2-24: Learn
1. Watch how signals appear
2. Check star ratings
3. Observe trend direction
4. Notice session highlights
5. Don't trade yet - just observe!
Day 2-7: Demo Trading
1. Open demo account
2. Trade ONLY 5-star signals
3. Use exact SL/TP from indicator
4. Risk $100 per trade (demo)
5. Keep journal of results
6. Review each trade (win or loss)
Week 2+: Real Trading
1. Start with SMALL real account ($100-500)
2. Risk only 1% per trade ($1-5)
3. Trade Conservative mode only
4. Build confidence slowly
5. Increase size as you improve
🔔 Alert System
Available Alerts:
1. BUY Signal
Triggers: When 4-5 star BUY appears
Message: "SMART BEGINNER PRO - BUY SIGNAL!"
Action: Check chart, enter if conditions met
2. SELL Signal
Triggers: When 4-5 star SELL appears
Message: "SMART BEGINNER PRO - SELL SIGNAL!"
Action: Check chart, enter if conditions met
3. 5-STAR BUY (Premium Quality)
Triggers: Only perfect 5-star BUY setups
Message: "PERFECT 5-STAR BUY SIGNAL!"
Action: Highest probability - don't miss!
4. 5-STAR SELL (Premium Quality)
Triggers: Only perfect 5-star SELL setups
Message: "PERFECT 5-STAR SELL SIGNAL!"
Action: Highest probability - don't miss!
Alert Setup:
1. Click "Create Alert" on indicator
2. Choose "BUY Signal" and "SELL Signal"
3. Set "Once Per Bar Close"
4. Enable notifications to phone/email
5. Never miss a quality setup!
📊 Best Practices
Daily Routine:
Before Market Open:
1. Check economic calendar
2. Identify trending pairs
3. Set up charts with indicator
4. Enable alerts
During Trading:
1. Wait for signal
2. Check star rating (4-5 only)
3. Verify "Safe to Trade" = YES
4. Enter with proper position size
5. Set SL/TP from boxes
6. Walk away (don't watch tick-by-tick)
After Trading:
1. Review trades in journal
2. What worked? What didn't?
3. Were they 4-5 star signals?
4. Did you follow rules?
5. Plan improvements
Position Sizing:
The 1% Rule:
Account: $1000
Risk per trade: 1% = $10
If SL is 20 pips away:
Position size = $10 / 20 pips = $0.50/pip
Simple! Never risk more than you can afford to lose.
🎯 Success Tips
From Professional Traders:
Tip #1: Quality Over Quantity
"Better to take 3 excellent trades per week
than 20 mediocre trades per day."
→ Focus on 5-star signals at first
Tip #2: Respect the Stop Loss
"The indicator calculated it for a reason.
Moving stops = breaking risk management."
→ Set it and honor it, always
Tip #3: Take Partial Profits
"Bank some profit at TP1, let the rest run to TP2.
This keeps you profitable even if TP2 doesn't hit."
→ Close 50% at TP1 (yellow box)
Tip #4: Trade Best Sessions
"London and New York overlap (1-4 PM GMT)
is the most liquid time of day."
→ Watch for green+blue background
Tip #5: Keep Learning
"Every trade is a lesson.
Winners teach confidence, losers teach discipline."
→ Journal everything, review weekly
⚠️ Important Disclaimers
Realistic Expectations:
This is NOT:
❌ A get-rich-quick scheme
❌ A 100% win rate system
❌ A replacement for education
❌ A guarantee of profits
❌ Financial advice
This IS:
✅ A learning tool
✅ A signal system with good probability
✅ A risk management helper
✅ A starting point for beginners
✅ An educational indicator
Trading Risks:
⚠️ All trading involves risk
⚠️ You can lose money
⚠️ Never trade with money you can't afford to lose
⚠️ Start small, grow slowly
⚠️ Past performance ≠ future results
⚠️ Demo trade first!
🎁 Bonus: Beginner's Checklist
Before Every Trade:
□ Signal appeared (BUY or SELL arrow)
□ Star rating is 4 or 5 stars
□ Dashboard shows "Safe to Trade: ✅ YES"
□ Trend and signal agree (both bullish or bearish)
□ Trading during London/NY session
□ Stop Loss level identified (red box)
□ Take Profit level identified (green box)
□ Position size calculated (1% risk max)
□ Emotionally ready (not revenge trading)
□ Have clear mind (not tired/stressed)
If ALL checked → TRADE
If ANY missing → SKIP
🎯 Final Words
Trading doesn't have to be complicated.
Smart Beginner Pro proves that you can:
Get professional results as a beginner
Learn proper trading techniques
Manage risk automatically
Understand WHY trades work
Build confidence step by step
This is your starting point.
Add it to your chart. Watch it work. Learn from it. Grow with it.
Welcome to professional trading! 🚀
📈 Ready to Start?
1. Click "Add to favorites"
2. Apply to your chart
3. Enable alerts
4. Wait for your first 5-star signal
5. Start your trading journey TODAY!
Questions? Comments? Success stories?
Share below! 👇
Happy Trading! 🎓📊✨
Disclaimer: This indicator is for educational purposes. Trading involves risk. Always use proper risk management and never trade with money you cannot afford to lose. Past performance does not guarantee future results.

Smart Liquidity & OTE Analysis Tool # Smart Liquidity & OTE Analysis Tool
## OVERVIEW
This indicator is designed for traders who utilize institutional trading concepts, specifically liquidity sweeps and optimal trade entry (OTE) zones, combined with session-based market structure analysis. It identifies potential market manipulation points where stop losses are likely clustered, and highlights high-probability entry zones based on Fibonacci retracements.
The tool combines four main analytical components that work synergistically to identify trading opportunities aligned with smart money behavior.
---
## CORE CONCEPTS & METHODOLOGY
### 1. TRADING SESSIONS ANALYSIS
**What it does:**
The indicator tracks three major forex trading sessions with customizable time zones:
- **Asian Session** (Default: 01:00-13:00 UTC+4) - Typically characterized by range-bound price action
- **London Session** (Default: 11:00-20:00 UTC+4) - High volatility period with increased institutional activity
- **New York Session** (Default: 17:00-00:00 UTC+4) - Overlaps with London creating peak liquidity
**How it works:**
- Automatically highlights active sessions with colored background boxes
- Draws session high/low lines which often act as intraday support/resistance
- Identifies session overlaps (e.g., London-NY overlap) where volatility and liquidity are highest
- Color-codes the price bars during overlaps to alert traders to increased opportunity periods
- Displays real-time session status (🟢 Open / 🔴 Closed) for quick reference
**Trading Application:**
Session highs and lows frequently become liquidity targets. The indicator helps traders anticipate when price might sweep these levels before continuing in the original direction. Session overlaps are prime times for major moves as multiple institutional players are active simultaneously.
---
### 2. EXTERNAL LIQUIDITY SWEEPS
**What it does:**
Identifies when price "sweeps" or breaks beyond significant swing highs and lows where stop losses are typically clustered. These sweeps often precede reversals or continuations after liquidity is collected.
**How it works:**
- Scans the previous 20 bars (configurable) to identify swing high and low points
- Marks these levels as "buyside liquidity" (above highs) or "sellside liquidity" (below lows)
- Monitors price action using three detection methods:
* **Wick Break:** Any candle wick extending beyond the liquidity level
* **Close Break:** Candle body closing beyond the level (stronger confirmation)
* **Full Retrace:** Price breaks the level then closes back inside the range (classic liquidity grab)
- Uses an ATR-based buffer to avoid false signals from minor price spikes
- Confirms sweeps only after a configurable number of confirmation bars to reduce repainting
**The Logic Behind It:**
Institutional traders need liquidity to fill large orders. Stop losses clustered above swing highs and below swing lows provide this liquidity. When these levels are swept, it often indicates smart money is entering positions in the opposite direction, causing reversals.
**Visual Representation:**
- Blue horizontal lines mark buyside liquidity zones (above price)
- Gray horizontal lines mark sellside liquidity zones (below price)
- Labels indicate when liquidity has been swept (✓) or remains active
- Historical zones are maintained for context (configurable display limit)
---
### 3. INTERNAL LIQUIDITY DETECTION
**What it does:**
Identifies equal highs (EQH) and equal lows (EQL) within recent price action - levels that have been tested multiple times without breaking. These represent internal liquidity pools that price often revisits before making larger moves.
**How it works:**
- Examines the most recent 8 bars (configurable) for price levels that occur multiple times
- Uses an ATR-based threshold (default 0.1% of ATR) to determine if highs or lows are "equal"
- Requires minimum 3 occurrences (configurable) of the same level to qualify as internal liquidity
- Tracks both the creation and sweeping of these internal levels
- Differentiates between wick breaks and close breaks for sweep confirmation
**The Concept:**
Unlike external liquidity at swing points, internal liquidity represents recent stop clusters and pending orders within the current price structure. Identifying these levels helps traders anticipate short-term price targets and potential reversal points before larger directional moves.
**Why This Matters:**
Price often needs to clear internal liquidity before making sustained moves to external liquidity levels. This creates a "roadmap" of where price is likely to go in sequence, improving trade timing.
**Visual Representation:**
- Cyan lines mark internal buyside liquidity (equal highs)
- Orange lines mark internal sellside liquidity (equal lows)
- Dashed or solid lines based on user preference
- Labels show when internal levels are swept
---
### 4. OPTIMAL TRADE ENTRY (OTE) ZONES
**What it does:**
Calculates and displays Fibonacci retracement zones (0.618-0.786) from recent swing points, representing "discount" or "premium" areas where institutional traders often enter positions after a liquidity sweep or structure break.
**How it works:**
- Identifies swing highs and lows using a 10-bar lookback period (configurable)
- Calculates three key Fibonacci levels:
* **0.618** - The "golden ratio" retracement (most significant)
* **0.705** - Mid-point between 0.618 and 0.786
* **0.786** - Deep retracement level (square root of 0.618)
- Optionally requires a structure break before displaying OTE zones
- Dynamically extends zones as new price action develops
- Tracks whether price has entered the zone (✅) or exited without filling (❌)
- Displays up to 2 most recent zones (configurable) to avoid chart clutter
**The Methodology:**
OTE zones represent areas where price is at a "discount" (for longs) or "premium" (for shorts) relative to the recent swing. After a liquidity sweep or structure break, institutional traders often wait for retracements into these zones before entering, as it offers better risk-to-reward ratios.
**Combining with Liquidity:**
The most powerful setups occur when:
1. External liquidity is swept
2. Price retraces into an OTE zone
3. Internal liquidity is present as a target
This confluence suggests smart money activity and high-probability trade opportunities.
**Visual Representation:**
- Shaded blue zone between 0.618 and 0.786 levels
- Three horizontal lines showing key Fibonacci levels with different colors/styles
- Labels (🎯) indicate bullish or bearish OTE zones
- Entry (✅) and exit (❌) status for each zone
---
## WHY THESE FEATURES WORK TOGETHER
This indicator combines these four components because they represent different stages of institutional trading behavior:
1. **Session Timing** - Identifies WHEN institutional activity is highest
2. **Liquidity Sweeps** - Shows WHERE smart money is collecting liquidity
3. **OTE Zones** - Highlights WHERE institutional entries likely occur after sweeps
4. **Internal Liquidity** - Provides SHORT-TERM targets for profit-taking or add-ons
Rather than using each concept in isolation, this integration creates a complete market structure framework. For example:
- A buyside liquidity sweep during London open →
- Followed by a retrace into a bullish OTE zone →
- With internal sellside liquidity as the initial target
This sequence represents a complete high-probability trade setup aligned with smart money principles.
---
## ANTI-REPAINTING FEATURES
**The Repainting Problem:**
Many indicators that identify patterns on historical data repaint their signals when live trading, showing signals that weren't actually there in real-time. This creates a false sense of accuracy.
**Our Solution:**
- **Confirmation Bars Setting:** Signals only appear after X bars have confirmed the pattern (default: 2 bars)
- **Marked Confirmation:** Labels show "C" when using confirmed signals
- **Trade-off:** More confirmation = less repainting but slightly delayed signals
- **User Control:** Traders can toggle between real-time signals (faster but may repaint) and confirmed signals (delayed but reliable)
---
## KEY CUSTOMIZATION OPTIONS
### Master Controls
- Toggle each major feature on/off independently
- Combine only the features relevant to your trading style
### Display Settings
- Adjust lookback periods for each component
- Control number of historical zones displayed
- Customize colors, line styles, and transparency
- Show/hide labels and session names
- Configure text sizes for different screen setups
### Detection Sensitivity
- **Sweep Detection:** Choose between wick breaks, close breaks, or full retraces
- **ATR Buffer:** Add distance requirements to confirm sweeps (reduces false signals)
- **Equal Level Threshold:** Adjust how close levels must be to qualify as "equal"
- **Confirmation Bars:** Balance between signal speed and reliability
### Alert System
- Session open/close notifications
- Liquidity sweep alerts
- OTE zone entry alerts
- Configurable alert frequency and types
---
## HOW TO USE THIS INDICATOR
### Basic Setup
1. Add the indicator to your chart (works on all timeframes, though 5M-1H recommended for intraday)
2. Enable the features you want to use via Master Controls
3. Adjust colors and transparency to match your chart preferences
4. Configure alert preferences if using notifications
### Trading Workflow
**Step 1: Identify the Session**
- Determine which trading session is active or approaching
- Note session highs/lows as potential liquidity targets
- Be especially alert during session overlaps
**Step 2: Watch for Liquidity Sweeps**
- Monitor external liquidity lines (swing highs/lows)
- When price sweeps liquidity, anticipate a potential reversal
- Stronger sweeps (close breaks + full retraces) are more significant
**Step 3: Wait for OTE Retracement**
- After a sweep, wait for price to retrace into the OTE zone (0.618-0.786)
- Bullish OTE after sellside sweep = potential long
- Bearish OTE after buyside sweep = potential short
**Step 4: Use Internal Liquidity as Targets**
- Look for internal liquidity in the direction of your trade
- These serve as initial profit targets
- External liquidity serves as extended targets
**Step 5: Manage Confirmation Settings**
- For live trading, use confirmed signals (2+ confirmation bars)
- For backtesting or analysis, you may use real-time signals
- Note that confirmed signals appear with "C" marking
### Example Trade Scenarios
**Bullish Setup:**
1. London session opens (increased volume)
2. Price sweeps sellside liquidity below Asian low
3. Price retraces into bullish OTE zone (0.618-0.786 of the sweep move)
4. Target internal buyside liquidity, then external buyside liquidity
**Bearish Setup:**
1. NY session overlap with London (peak liquidity)
2. Price sweeps buyside liquidity above recent high
3. Price retraces into bearish OTE zone
4. Target internal sellside liquidity, then session lows
---
## BEST PRACTICES
### What This Indicator Does Well
✓ Identifies high-probability institutional trading zones
✓ Provides clear visual roadmap of likely price targets
✓ Reduces chart clutter with configurable history limits
✓ Works across multiple timeframes and instruments
✓ Minimizes repainting with confirmation settings
### What This Indicator Doesn't Do
✗ Does not provide entry/exit arrows (intentional - requires trader discretion)
✗ Does not guarantee winning trades (no indicator does)
✗ Does not work in isolation (combine with price action/market context)
✗ Does not replace risk management (always use stop losses)
### Recommended Complementary Analysis
- Price action patterns (engulfing candles, pinbars at OTE zones)
- Volume profile or footprint charts for order flow confirmation
- Higher timeframe trend context (don't fade strong trends)
- Economic calendar awareness (avoid major news events)
---
## TECHNICAL NOTES
### Performance Optimization
- Uses max_bars_back limitation to reduce memory usage
- Automatic cleanup of old zones to prevent slowdown
- Efficient array management with configurable display limits
- Suitable for both intraday and swing trading timeframes
### Timeframe Recommendations
- **1-5 Minute:** Scalping with tight internal liquidity targets
- **15-30 Minute:** Intraday trading with session-based setups
- **1-4 Hour:** Swing trading with multi-session analysis
- **Daily:** Position trading using weekly liquidity levels
### Instrument Compatibility
Works on all liquid instruments:
- Forex pairs (optimal due to clear sessions)
- Stock index futures (ES, NQ, etc.)
- Cryptocurrency (24/7 markets - use custom session times)
- Individual stocks (less pronounced session effects)
---
## EDUCATIONAL RESOURCES
To better understand the concepts used in this indicator:
**Liquidity Concepts:**
- Study institutional order flow and stop loss hunting
- Learn about market microstructure and liquidity provision
- Understand the difference between retail and institutional trading
**Fibonacci/OTE:**
- Research Fibonacci retracements in trending markets
- Study the mathematical significance of the golden ratio (0.618)
- Practice identifying retracement entries on historical charts
**Session Trading:**
- Analyze volume profiles during different forex sessions
- Study typical price behavior during session overlaps
- Understand timezone conversions for your local trading hours
---
## VERSION HISTORY & UPDATES
This script represents a complete integration of multiple smart money concepts into a single, cohesive tool. Future updates will be published using the Update feature rather than creating separate scripts for minor variations.
---
## DISCLAIMER
This indicator is for educational and informational purposes only. It does not constitute financial advice or trading recommendations. All trading involves risk, and past performance does not guarantee future results. Always practice proper risk management and never risk more than you can afford to lose.
The concepts presented here (liquidity sweeps, OTE zones, session analysis) are widely discussed trading theories. This indicator is an interpretation and visualization of these concepts, not a guarantee of their effectiveness.
---
## SETTINGS SUMMARY
**Master Controls:** Enable/disable each major feature independently
**Repainting Controls:** Adjust confirmation requirements for signals
**Trading Sessions:** Customize session times, colors, and display options
**External Liquidity:** Configure detection sensitivity and visual styling
**Internal Liquidity:** Adjust lookback periods and threshold sensitivity
**OTE Zones:** Select which Fibonacci levels to display and entry requirements
**Alerts:** Configure notifications for sessions, sweeps, and entries
---
## SUPPORT & FEEDBACK
If you find this indicator helpful, please leave a like and comment with your feedback. For questions about specific settings or concepts, refer to the tooltips in the indicator settings panel - each parameter includes a detailed explanation.
Remember: The best indicator is the one you understand and can apply consistently within your trading plan. Take time to practice with this tool on demo accounts before risking real capital.

[Yorsh] BJN Liquidity Matrix v1.0Indicator Analysis & Performance Report: BJN Liquidity Matrix v1.0
1. Executive Summary
The BJN Liquidity Matrix v1.0 is a sophisticated, professional-grade trading indicator for TradingView, built on the modern PineScript v6. It is designed to provide traders with a comprehensive and highly customizable view of market liquidity, time-based events, and price structure.
Its primary differentiator in a crowded market is its performance-first architecture. While most multi-feature indicators cause significant chart lag and slow performance, this tool is meticulously engineered to be lightweight, fast, and reliable, ensuring that your trading analysis is never compromised by technical bottlenecks. It delivers a full suite of institutional trading concepts without sacrificing speed.
2. Core Features Overview
The indicator seamlessly integrates several key analytical concepts into a single, cohesive toolkit.
A. Advanced Time Analysis
Customizable Killzone Boxes: Automatically draws key trading sessions (Asia, London, NY AM, NY Lunch, NY PM) on the chart. This helps visualize the high and low of each session, which often act as critical support and resistance levels.
Session High/Low Lines: Extends horizontal lines from the identified highs and lows of each Killzone, allowing you to track these liquidity points throughout the trading day.
Macro Time Highlighting: Visually alerts you when the market enters specific "macro" time windows, which are often periods of increased volatility and algorithmic activity.
B. Multi-Layered Liquidity & Price Structure
Current Timeframe (CTF) Swings: Automatically identifies and plots short-term swing highs and lows on your active chart, providing a clear map of immediate liquidity pools.
Higher Timeframe (HTF) Liquidity: Plots key fractals from the 1-hour timeframe directly onto your chart, tagged as "1H
". This saves you from constantly switching timeframes to find significant swing points.
Previous Day High/Low (PDH/PDL): Clearly marks the previous day's high and low with clean, auto-adjusting labels. These are fundamental levels watched by all market participants.
C. Integrated Market Bias Tools
Daily BIAS: Draws a dynamic equilibrium price (50% level) based on the current day's developing range. This acts as a simple but powerful bias filter: favoring longs below it and shorts above it.
Probabilistic Hourly Bias: A unique feature that analyzes the closing price of the previous hourly candle to provide a statistical probability of the market taking out the previous hour's high or low.
D. The "Smart Status" Information Hub
This is the indicator's central dashboard. Instead of cluttering your chart with dozens of lines, this dynamic table intelligently sorts and displays the most relevant, un-taken liquidity levels above and below the current price. It automatically updates as levels are breached, providing a clean, at-a-glance view of:
Nearest Buy-Side & Sell-Side Liquidity
Untouched Session Highs/Lows
Active PDH/PDL levels
The Hourly Bias probability (when active and not taken)
3. The Performance Advantage: A Smoother Trading Experience
This indicator was engineered to outperform its competitors by focusing on computational efficiency. This is not just a feature; it is the core design philosophy.
Efficient Drawing Management: Most indicators slow down charts by continuously drawing thousands of objects over historical data. The BJN Liquidity Matrix uses an advanced system to only draw what is necessary. It intelligently limits drawings to a recent, user-defined period (e.g., the last 2 days), preventing historical clutter that cripples browser performance.
Smart De-Cluttering: Broken liquidity levels are not left on the chart indefinitely. The script will automatically hide old, irrelevant lines after a set number of hours, keeping your workspace clean and focused on current market structure.
Minimal Data Requests: The script uses internal caching for data like in example the Previous Day Highs/Lows. This means it fetches the data once and reuses it, drastically reducing requests to TradingView's servers and resulting in faster script loading times and reloads.
On-Demand Table Refresh: The comprehensive "Smart Status" table—a feature that would typically cause constant lag—is programmed to only perform its heavy recalculations on the very last bar. This means it doesn't slow down historical data or cause screen-tearing while the market is active.
In summary, you get all the analytical power without the lag, freezing, or slow loading times that plague other "all-in-one" liquidity indicators.
4. Ideal User Profile
This indicator is an ideal tool for:
Day Traders & Scalpers: Who rely on session liquidity and intraday price structure.
SMC / ICT Traders: Who base their strategies on concepts like liquidity grabs, fractals, and time-based models.
Performance-Conscious Traders: Anyone who uses multiple indicators or trades on a less powerful computer and cannot afford chart lag.

SLO Pro-J-Algo # Smart Liquidity & OTE Analysis Tool
## OVERVIEW
This indicator is designed for traders who utilize institutional trading concepts, specifically liquidity sweeps and optimal trade entry (OTE) zones, combined with session-based market structure analysis. It identifies potential market manipulation points where stop losses are likely clustered, and highlights high-probability entry zones based on Fibonacci retracements.
The tool combines four main analytical components that work synergistically to identify trading opportunities aligned with smart money behavior.
---
## CORE CONCEPTS & METHODOLOGY
### 1. TRADING SESSIONS ANALYSIS
**What it does:**
The indicator tracks three major forex trading sessions with customizable time zones:
- **Asian Session** (Default: 01:00-13:00 UTC+4) - Typically characterized by range-bound price action
- **London Session** (Default: 11:00-20:00 UTC+4) - High volatility period with increased institutional activity
- **New York Session** (Default: 17:00-00:00 UTC+4) - Overlaps with London creating peak liquidity
**How it works:**
- Automatically highlights active sessions with colored background boxes
- Draws session high/low lines which often act as intraday support/resistance
- Identifies session overlaps (e.g., London-NY overlap) where volatility and liquidity are highest
- Color-codes the price bars during overlaps to alert traders to increased opportunity periods
- Displays real-time session status (🟢 Open / 🔴 Closed) for quick reference
**Trading Application:**
Session highs and lows frequently become liquidity targets. The indicator helps traders anticipate when price might sweep these levels before continuing in the original direction. Session overlaps are prime times for major moves as multiple institutional players are active simultaneously.
---
### 2. EXTERNAL LIQUIDITY SWEEPS
**What it does:**
Identifies when price "sweeps" or breaks beyond significant swing highs and lows where stop losses are typically clustered. These sweeps often precede reversals or continuations after liquidity is collected.
**How it works:**
- Scans the previous 20 bars (configurable) to identify swing high and low points
- Marks these levels as "buyside liquidity" (above highs) or "sellside liquidity" (below lows)
- Monitors price action using three detection methods:
* **Wick Break:** Any candle wick extending beyond the liquidity level
* **Close Break:** Candle body closing beyond the level (stronger confirmation)
* **Full Retrace:** Price breaks the level then closes back inside the range (classic liquidity grab)
- Uses an ATR-based buffer to avoid false signals from minor price spikes
- Confirms sweeps only after a configurable number of confirmation bars to reduce repainting
**The Logic Behind It:**
Institutional traders need liquidity to fill large orders. Stop losses clustered above swing highs and below swing lows provide this liquidity. When these levels are swept, it often indicates smart money is entering positions in the opposite direction, causing reversals.
**Visual Representation:**
- Blue horizontal lines mark buyside liquidity zones (above price)
- Gray horizontal lines mark sellside liquidity zones (below price)
- Labels indicate when liquidity has been swept (✓) or remains active
- Historical zones are maintained for context (configurable display limit)
---
### 3. INTERNAL LIQUIDITY DETECTION
**What it does:**
Identifies equal highs (EQH) and equal lows (EQL) within recent price action - levels that have been tested multiple times without breaking. These represent internal liquidity pools that price often revisits before making larger moves.
**How it works:**
- Examines the most recent 8 bars (configurable) for price levels that occur multiple times
- Uses an ATR-based threshold (default 0.1% of ATR) to determine if highs or lows are "equal"
- Requires minimum 3 occurrences (configurable) of the same level to qualify as internal liquidity
- Tracks both the creation and sweeping of these internal levels
- Differentiates between wick breaks and close breaks for sweep confirmation
**The Concept:**
Unlike external liquidity at swing points, internal liquidity represents recent stop clusters and pending orders within the current price structure. Identifying these levels helps traders anticipate short-term price targets and potential reversal points before larger directional moves.
**Why This Matters:**
Price often needs to clear internal liquidity before making sustained moves to external liquidity levels. This creates a "roadmap" of where price is likely to go in sequence, improving trade timing.
**Visual Representation:**
- Cyan lines mark internal buyside liquidity (equal highs)
- Orange lines mark internal sellside liquidity (equal lows)
- Dashed or solid lines based on user preference
- Labels show when internal levels are swept
---
### 4. OPTIMAL TRADE ENTRY (OTE) ZONES
**What it does:**
Calculates and displays Fibonacci retracement zones (0.618-0.786) from recent swing points, representing "discount" or "premium" areas where institutional traders often enter positions after a liquidity sweep or structure break.
**How it works:**
- Identifies swing highs and lows using a 10-bar lookback period (configurable)
- Calculates three key Fibonacci levels:
* **0.618** - The "golden ratio" retracement (most significant)
* **0.705** - Mid-point between 0.618 and 0.786
* **0.786** - Deep retracement level (square root of 0.618)
- Optionally requires a structure break before displaying OTE zones
- Dynamically extends zones as new price action develops
- Tracks whether price has entered the zone (✅) or exited without filling (❌)
- Displays up to 2 most recent zones (configurable) to avoid chart clutter
**The Methodology:**
OTE zones represent areas where price is at a "discount" (for longs) or "premium" (for shorts) relative to the recent swing. After a liquidity sweep or structure break, institutional traders often wait for retracements into these zones before entering, as it offers better risk-to-reward ratios.
**Combining with Liquidity:**
The most powerful setups occur when:
1. External liquidity is swept
2. Price retraces into an OTE zone
3. Internal liquidity is present as a target
This confluence suggests smart money activity and high-probability trade opportunities.
**Visual Representation:**
- Shaded blue zone between 0.618 and 0.786 levels
- Three horizontal lines showing key Fibonacci levels with different colors/styles
- Labels (🎯) indicate bullish or bearish OTE zones
- Entry (✅) and exit (❌) status for each zone
---
## WHY THESE FEATURES WORK TOGETHER
This indicator combines these four components because they represent different stages of institutional trading behavior:
1. **Session Timing** - Identifies WHEN institutional activity is highest
2. **Liquidity Sweeps** - Shows WHERE smart money is collecting liquidity
3. **OTE Zones** - Highlights WHERE institutional entries likely occur after sweeps
4. **Internal Liquidity** - Provides SHORT-TERM targets for profit-taking or add-ons
Rather than using each concept in isolation, this integration creates a complete market structure framework. For example:
- A buyside liquidity sweep during London open →
- Followed by a retrace into a bullish OTE zone →
- With internal sellside liquidity as the initial target
This sequence represents a complete high-probability trade setup aligned with smart money principles.
---
## ANTI-REPAINTING FEATURES
**The Repainting Problem:**
Many indicators that identify patterns on historical data repaint their signals when live trading, showing signals that weren't actually there in real-time. This creates a false sense of accuracy.
**Our Solution:**
- **Confirmation Bars Setting:** Signals only appear after X bars have confirmed the pattern (default: 2 bars)
- **Marked Confirmation:** Labels show "C" when using confirmed signals
- **Trade-off:** More confirmation = less repainting but slightly delayed signals
- **User Control:** Traders can toggle between real-time signals (faster but may repaint) and confirmed signals (delayed but reliable)
---
## KEY CUSTOMIZATION OPTIONS
### Master Controls
- Toggle each major feature on/off independently
- Combine only the features relevant to your trading style
### Display Settings
- Adjust lookback periods for each component
- Control number of historical zones displayed
- Customize colors, line styles, and transparency
- Show/hide labels and session names
- Configure text sizes for different screen setups
### Detection Sensitivity
- **Sweep Detection:** Choose between wick breaks, close breaks, or full retraces
- **ATR Buffer:** Add distance requirements to confirm sweeps (reduces false signals)
- **Equal Level Threshold:** Adjust how close levels must be to qualify as "equal"
- **Confirmation Bars:** Balance between signal speed and reliability
### Alert System
- Session open/close notifications
- Liquidity sweep alerts
- OTE zone entry alerts
- Configurable alert frequency and types
---
## HOW TO USE THIS INDICATOR
### Basic Setup
1. Add the indicator to your chart (works on all timeframes, though 5M-1H recommended for intraday)
2. Enable the features you want to use via Master Controls
3. Adjust colors and transparency to match your chart preferences
4. Configure alert preferences if using notifications
### Trading Workflow
**Step 1: Identify the Session**
- Determine which trading session is active or approaching
- Note session highs/lows as potential liquidity targets
- Be especially alert during session overlaps
**Step 2: Watch for Liquidity Sweeps**
- Monitor external liquidity lines (swing highs/lows)
- When price sweeps liquidity, anticipate a potential reversal
- Stronger sweeps (close breaks + full retraces) are more significant
**Step 3: Wait for OTE Retracement**
- After a sweep, wait for price to retrace into the OTE zone (0.618-0.786)
- Bullish OTE after sellside sweep = potential long
- Bearish OTE after buyside sweep = potential short
**Step 4: Use Internal Liquidity as Targets**
- Look for internal liquidity in the direction of your trade
- These serve as initial profit targets
- External liquidity serves as extended targets
**Step 5: Manage Confirmation Settings**
- For live trading, use confirmed signals (2+ confirmation bars)
- For backtesting or analysis, you may use real-time signals
- Note that confirmed signals appear with "C" marking
### Example Trade Scenarios
**Bullish Setup:**
1. London session opens (increased volume)
2. Price sweeps sellside liquidity below Asian low
3. Price retraces into bullish OTE zone (0.618-0.786 of the sweep move)
4. Target internal buyside liquidity, then external buyside liquidity
**Bearish Setup:**
1. NY session overlap with London (peak liquidity)
2. Price sweeps buyside liquidity above recent high
3. Price retraces into bearish OTE zone
4. Target internal sellside liquidity, then session lows
---
## BEST PRACTICES
### What This Indicator Does Well
✓ Identifies high-probability institutional trading zones
✓ Provides clear visual roadmap of likely price targets
✓ Reduces chart clutter with configurable history limits
✓ Works across multiple timeframes and instruments
✓ Minimizes repainting with confirmation settings
### What This Indicator Doesn't Do
✗ Does not provide entry/exit arrows (intentional - requires trader discretion)
✗ Does not guarantee winning trades (no indicator does)
✗ Does not work in isolation (combine with price action/market context)
✗ Does not replace risk management (always use stop losses)
### Recommended Complementary Analysis
- Price action patterns (engulfing candles, pinbars at OTE zones)
- Volume profile or footprint charts for order flow confirmation
- Higher timeframe trend context (don't fade strong trends)
- Economic calendar awareness (avoid major news events)
---
## TECHNICAL NOTES
### Performance Optimization
- Uses max_bars_back limitation to reduce memory usage
- Automatic cleanup of old zones to prevent slowdown
- Efficient array management with configurable display limits
- Suitable for both intraday and swing trading timeframes
### Timeframe Recommendations
- **1-5 Minute:** Scalping with tight internal liquidity targets
- **15-30 Minute:** Intraday trading with session-based setups
- **1-4 Hour:** Swing trading with multi-session analysis
- **Daily:** Position trading using weekly liquidity levels
### Instrument Compatibility
Works on all liquid instruments:
- Forex pairs (optimal due to clear sessions)
- Stock index futures (ES, NQ, etc.)
- Cryptocurrency (24/7 markets - use custom session times)
- Individual stocks (less pronounced session effects)
---
## EDUCATIONAL RESOURCES
To better understand the concepts used in this indicator:
**Liquidity Concepts:**
- Study institutional order flow and stop loss hunting
- Learn about market microstructure and liquidity provision
- Understand the difference between retail and institutional trading
**Fibonacci/OTE:**
- Research Fibonacci retracements in trending markets
- Study the mathematical significance of the golden ratio (0.618)
- Practice identifying retracement entries on historical charts
**Session Trading:**
- Analyze volume profiles during different forex sessions
- Study typical price behavior during session overlaps
- Understand timezone conversions for your local trading hours
---
## VERSION HISTORY & UPDATES
This script represents a complete integration of multiple smart money concepts into a single, cohesive tool. Future updates will be published using the Update feature rather than creating separate scripts for minor variations.
---
## DISCLAIMER
This indicator is for educational and informational purposes only. It does not constitute financial advice or trading recommendations. All trading involves risk, and past performance does not guarantee future results. Always practice proper risk management and never risk more than you can afford to lose.
The concepts presented here (liquidity sweeps, OTE zones, session analysis) are widely discussed trading theories. This indicator is an interpretation and visualization of these concepts, not a guarantee of their effectiveness.
---
## SETTINGS SUMMARY
**Master Controls:** Enable/disable each major feature independently
**Repainting Controls:** Adjust confirmation requirements for signals
**Trading Sessions:** Customize session times, colors, and display options
**External Liquidity:** Configure detection sensitivity and visual styling
**Internal Liquidity:** Adjust lookback periods and threshold sensitivity
**OTE Zones:** Select which Fibonacci levels to display and entry requirements
**Alerts:** Configure notifications for sessions, sweeps, and entries
---
## SUPPORT & FEEDBACK
If you find this indicator helpful, please leave a like and comment with your feedback. For questions about specific settings or concepts, refer to the tooltips in the indicator settings panel - each parameter includes a detailed explanation.
Remember: The best indicator is the one you understand and can apply consistently within your trading plan. Take time to practice with this tool on demo accounts before risking real capital.

HTF Hi-Lo Zones [CHE]HTF Hi-Lo Zones Indicator
The HTF Hi-Lo Zones Indicator is a Pine Script tool designed to highlight important high and low values from a selected higher timeframe. It provides traders with clear visual zones where price activity has reached significant points, helping in decision-making by identifying potential support and resistance levels. This indicator is customizable, allowing users to select the resolution type, control the visualization of session ranges, and even display detailed information about the chosen timeframe.
Key Functionalities
1. Timeframe Resolution Selection:
- The indicator offers three modes to determine the resolution:
- Automatic: Dynamically calculates the higher timeframe based on the current chart's resolution.
- Multiplier: Allows users to apply a multiplier to the current chart's timeframe.
- Manual: Enables manual input for custom resolution settings.
- Each resolution type ensures flexibility to suit different trading styles and strategies.
2. Data Fetching for High and Low Values:
- The indicator retrieves the current high and low values for the selected higher timeframe using `request.security`.
- It also calculates the lowest and highest values over a configurable lookback period, providing insights into significant price movements within the chosen timeframe.
3. Session High and Low Detection:
- The indicator detects whether the current value represents a new session high or low by comparing the highest and lowest values with the current data.
- This is crucial for identifying breakouts or significant turning points during a session.
4. Visual Representation:
- When a new session high or low is detected:
- Range Zones: A colored box marks the session's high-to-low range.
- Labels: Optional labels indicate "New High" or "New Low" for clarity.
- Users can customize colors, transparency, and whether range outlines or labels should be displayed.
5. Information Box:
- An optional dashboard displays details about the chosen timeframe resolution and current session activity.
- The box's size, position, and colors are fully customizable.
6. Session Tracking:
- Tracks session boundaries, updating the visualization dynamically as the session progresses.
- Displays session-specific maximum and minimum values if enabled.
7. Additional Features:
- Configurable dividers for session or daily boundaries.
- Transparency and styling options for the displayed zones.
- A dashboard for advanced visualization and information overlay.
Key Code Sections Explained
1. Resolution Determination:
- Depending on the user's input (Auto, Multiplier, or Manual), the script determines the appropriate timeframe resolution for higher timeframe analysis.
- The resolution adapts dynamically based on intraday, daily, or higher-period charts.
2. Fetching Security Data:
- Using the `getSecurityDataFunction`, the script fetches high and low values for the chosen timeframe, including historical and real-time data management to avoid repainting issues.
3. Session High/Low Logic:
- By comparing the highest and lowest values over a lookback period, the script identifies whether the current value is a new session high or low, updating session boundaries and initiating visual indicators.
4. Visualization:
- The script creates visual representations using `box.new` for range zones and `label.new` for session labels.
- These elements update dynamically to reflect the most recent data.
5. Customization Options:
- Users can configure the appearance, behavior, and displayed data through multiple input options, ensuring adaptability to individual trading preferences.
This indicator is a robust tool for tracking higher timeframe activity, offering a blend of automation, customization, and visual clarity to enhance trading strategies.
Disclaimer
The content provided, including all code and materials, is strictly for educational and informational purposes only. It is not intended as, and should not be interpreted as, financial advice, a recommendation to buy or sell any financial instrument, or an offer of any financial product or service. All strategies, tools, and examples discussed are provided for illustrative purposes to demonstrate coding techniques and the functionality of Pine Script within a trading context.
Any results from strategies or tools provided are hypothetical, and past performance is not indicative of future results. Trading and investing involve high risk, including the potential loss of principal, and may not be suitable for all individuals. Before making any trading decisions, please consult with a qualified financial professional to understand the risks involved.
By using this script, you acknowledge and agree that any trading decisions are made solely at your discretion and risk.
Best regards and happy trading
Chervolino

NDOG + ASIA CONFLUENCENDOG (New Day Opening Gap) Visualization:
The indicator identifies and visualizes New Day Opening Gaps (NDOGs), which are essentially the differences between the opening price of a new trading day and the closing price of the previous day.
For each NDOG identified, it creates a box on the chart that highlights the high and low price range of the NDOG.
The color of these boxes, as well as the number of NDOGs to be displayed, can be customized by the user.
Asia Session Highlighting:
The indicator includes a feature to highlight the Asia trading session, typically spanning from 18:00 to 00:00, but customizable to suit different time zones or preferences.
It does not dynamically calculate or display the Asia session but uses a fixed time input by the user.
The color for highlighting the Asia session can be chosen by the user.
Additional Lines on NDOGs:
The script draws horizontal lines at the high and low of each NDOG, spanning from 18:00 to 00:00, to visually represent the range of the NDOG during the Asia session.
The color of these lines can be customized.
Customizability:
The indicator provides various input options for users to customize the colors of the NDOG boxes and the lines that represent the high and low of the NDOGs.
Purpose and Usage:
This indicator is useful for traders who focus on price gaps between trading days and are particularly interested in the price action during the Asia trading session.
It helps in identifying potential zones of interest where significant price movements or trading activities could occur, especially at the opening of a new trading day.

GOLDEN BOX**Golden Box Trading Strategy Indicator**
The "Golden Box" trading strategy indicator is a visual tool designed to facilitate the execution of the Golden Box trading strategy on the TradingView platform. This strategy involves identifying potential buy and sell signals based on specific price movements within defined trading sessions.
**Features:**
- Custom session definition with adjustable time and time zone settings.
- Real-time tracking of session high, low, open, and close prices.
- Visual representation of trading sessions with highlighted high and low price ranges.
- Condition-based buy and sell signals based on closing prices and session levels.
- Informative tables outlining step-by-step strategy execution for both buy and sell scenarios.
**Strategy Highlights:**
- **Buy Strategy:** Wait for Monday's session completion. If the last candle's closing price is above the session's 50% level, set a pending buy limit order. Stop loss at the session high (100% level), take profits at 75% and 100%.
- **Sell Strategy:** Wait for Monday's session completion. If the last candle's closing price is below the session's 50% level, place a pending sell limit order. Stop loss at the session high (100% level), take profits at 25% and 0%.
**Disclaimer:** This indicator is for educational purposes and does not offer financial advice. Thoroughly understand the strategy and conduct testing before implementing it in live trading.
---
Feel free to modify this description to align with your preferences and to add any additional information that you believe will help users understand the indicator and strategy better.

IndiAllsIndiAlls is a versatile overlay indicator designed for traders analyzing market structure, sessions, and key level. It combines several popular tools into one script, including session highs/lows, fair value gaps (FVG), macro time trackers, RSI dashboards, displacement detection, engulfing candles, and various line drawings (e.g., midnight opens, vertical lines). This indicator is intended for educational and analytical purposes, helping users visualize potential support/resistance levels, gaps, and momentum across timeframes.
Key Features
Session Highs/Lows: Tracks and draws lines for Asian and London sessions, previous day/week, and pre-market highs/lows. Lines extend until mitigated by price, with optional labels.
Midnight and 8:30 Open Lines: Plots customizable lines at midnight and 8:30 AM (America/New_York time) with styles (solid, dotted, dashed) and history options.
Fair Value Gaps (FVG): Detects bullish/bearish gaps based on a threshold percentage, draws extendable boxes, and removes them when filled (mitigated).
Macro Time Tracker: Highlights specific 20-minute "macro" windows (e.g., 8:50-9:10 AM) with lines and labels, optimized for 15-minute charts, including Friday adjustments.
Vertical Lines: Draws time-based vertical lines (e.g., every 15/30/60 minutes) within user-defined hours.
RSI Dashboard: A table displaying RSI values across multiple timeframes (1m, 2m, 3m, 5m, 15m, 1h) with color-coded overbought/oversold highlights.
Displacement Detection: Colors bars where candle range exceeds a standard deviation threshold, optionally requiring an FVG.
Engulfing Candles: Highlights bullish/bearish engulfing patterns based on size and body ratios.
How to Use
Add the indicator to your chart (works best on intraday timeframes like 1m-15m for stocks/futures).
Adjust inputs in the settings panel to enable/disable features and customize colors, widths, and thresholds.
Interpret visuals:
- Lines and boxes indicate potential key levels or gaps—watch for price interactions (e.g., bounces or breaks).
- Bar colors highlight displacement or engulfing patterns for momentum insights.
- The RSI table provides multi-timeframe overbought/oversold context.
Combine with other tools (e.g., volume, moving averages) for comprehensive analysis. Test on historical data to understand behavior.
This indicator is overlay-based and does not plot traditional series but uses lines, boxes, labels, and tables for visualization.
Input Settings
Session High/Low Settings: Toggle Asian/London/Prev Day/Week displays, colors, widths, and label sizes.
Midnight/True Day Open and 8:30 Open: Enable lines, styles (solid/dotted/dashed), colors, and history.
Pre-Market Data High/Low: Toggle pre-market (7-9 AM) highs/lows, colors, widths, and labels.
Macro Time: Enable specific macro windows (e.g., 8:50-9:10) with text options.
Fair Value Gap Settings: Toggle FVG, threshold %, extend length, colors, and timeframe.
Vertical Lines Settings: Toggle lines, timeframe (15m/30m/1h), style, color, and hour range.
RSI Dashboard Settings: Toggle dashboard, position, size, transparency, and overbought/oversold levels.
Displacement Settings: Toggle detection, require FVG, type (open-close/high-low), strength, and color.
Engulfing Candle Settings: Toggle highlighting, bar ratio threshold, body/tail ratio, and color.
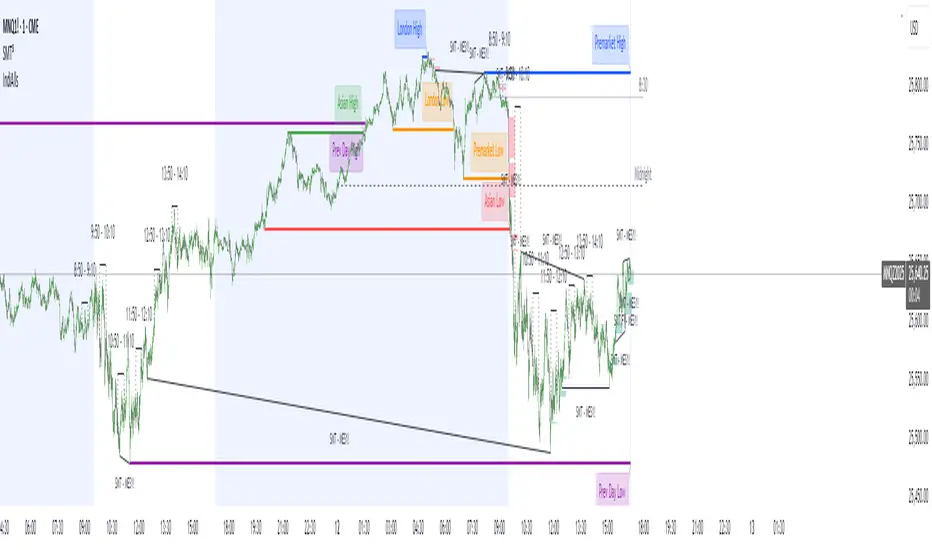
Advanced Smart Trading Suite with OTE═══════════════════════════════════════
ADVANCED SMART TRADING SUITE WITH OPTIMAL TRADE ENTRY
═══════════════════════════════════════
A comprehensive institutional trading system combining multiple advanced concepts including multi-timeframe liquidity analysis, order blocks, fair value gaps, and optimal trade entry zones. Features optional anti-repainting controls for confirmed signal generation.
───────────────────────────────────────
WHAT THIS INDICATOR DOES
───────────────────────────────────────
This all-in-one trading suite provides:
- Multi-Timeframe Liquidity Detection - HTF (Higher Timeframe), LTF (Lower Timeframe), and current timeframe liquidity sweep identification
- Order Blocks - Institutional accumulation/distribution zones with enhanced detection
- Fair Value Gaps (FVG) - Price imbalance detection
- Inverse Fair Value Gaps (iFVG) - Counter-trend imbalance zones
- Optimal Trade Entry (OTE) Zones - Fibonacci retracement-based entry zones (0.618-0.786)
- Trading Sessions - Asian, London, and New York session visualization
- Anti-Repainting Controls - Optional confirmed signals with adjustable confirmation bars
- Comprehensive Alert System - Notifications for all major events
───────────────────────────────────────
HOW IT WORKS
───────────────────────────────────────
ANTI-REPAINTING SYSTEM:
This indicator includes optional anti-repainting controls that fundamentally change how signals are generated:
Confirmed Mode (Recommended):
- Signals wait for confirmation bars before appearing
- No repainting - what you see is final
- Adjustable confirmation period (1-5 bars)
- Slight lag in signal generation
- Better for backtesting and systematic trading
Live Mode:
- Signals appear immediately as patterns develop
- May repaint as new bars form
- Faster signal generation
- Better for discretionary real-time trading
The confirmation system affects all features: liquidity sweeps, order blocks, FVGs, and OTE zones.
LIQUIDITY SWEEP DETECTION:
Three-Tier System:
1. Current Timeframe Liquidity:
- Detects swing highs/lows on chart timeframe
- Configurable lookback and confirmation periods
- Session-tagged for context (Asian/London/NY)
2. HTF (Higher Timeframe) Key Liquidity:
- Default: 4H timeframe (configurable to Daily/Weekly)
- Strength-based filtering using ATR multipliers
- Distance-based clustering prevention
- Only strongest levels displayed (top 1-10)
- Labels show timeframe and strength rating
3. LTF (Lower Timeframe) Key Liquidity:
- Default: 1H timeframe (configurable)
- Precision entry/exit levels
- Strength-based ranking
- Distance filtering to avoid clutter
Sweep Detection Methods:
- Wick Break: Any wick beyond the level
- Close Break: Close price beyond the level
- Full Retrace: Break and close back inside (stop hunt detection)
Buffer System:
- Configurable ATR-based buffer for sweep confirmation
- Prevents false positives from minor price fluctuations
ORDER BLOCKS (Enhanced):
Detection Methodology:
- Identifies the last opposing candle before significant structure break
- Bullish OB: Last red candle before bullish break
- Bearish OB: Last green candle before bearish break
Enhanced Filters:
1. Size Filter:
- Minimum order block size (ATR-based)
- Ensures significant zones only
2. Volume Filter:
- Requires above-average volume (configurable multiplier)
- Confirms institutional participation
3. Imbalance Filter:
- Requires strong directional move after OB formation
- Validates true institutional activity
Violation Detection:
- Wick-based: Any wick through the zone
- Close-based: Close price through the zone
- Automatic removal of broken order blocks
FAIR VALUE GAPS (FVG):
Bullish FVG: Gap between candle 3 low and candle 1 high (three-bar pattern)
Bearish FVG: Gap between candle 3 high and candle 1 low
Requirements:
- Minimum gap size (ATR-based)
- Clear price imbalance
- No overlap between the three candles
Fill Detection:
- Configurable fill threshold (default 50%)
- Tracks partial and complete fills
- Removes filled gaps to keep chart clean
INVERSE FAIR VALUE GAPS (iFVG):
What are iFVGs:
- Counter-trend FVGs that form after original FVG is filled
- Indicate potential reversal or continuation failure
- Form within specific timeframe after original FVG
Detection Rules:
- Must occur after a FVG is filled
- Must form within 20 bars of original FVG
- Minimum size requirement (ATR-based)
- Opposite direction to original FVG
Visual Distinction:
- Dashed border boxes
- Different color scheme from regular FVGs
- Combined labels when FVG and iFVG overlap
OPTIMAL TRADE ENTRY (OTE) ZONES:
Based on Fibonacci retracement principles used by institutional traders:
Concept:
After a structure break (swing high/low violation), price often retraces to specific Fibonacci levels before continuing. The OTE zone (0.618 to 0.786) represents the optimal entry area.
Bullish OTE Formation:
1. Swing low is formed
2. Structure breaks above previous swing high (bullish structure break)
3. Price retraces into 0.618-0.786 Fibonacci zone
4. Entry signal when price enters and holds in OTE zone
Bearish OTE Formation:
1. Swing high is formed
2. Structure breaks below previous swing low (bearish structure break)
3. Price retraces into 0.618-0.786 Fibonacci zone
4. Entry signal when price enters and holds in OTE zone
Key Fibonacci Levels:
- 0.618 (Golden ratio - primary target)
- 0.705 (Square root of 0.5 - institutional level)
- 0.786 (Square root of 0.618 - deep retracement)
Structure Break Requirement:
- Optional setting to require confirmed structure break
- Prevents premature OTE zone identification
- Ensures proper swing structure is established
Entry/Exit Tracking:
- Green checkmark: Price entered OTE zone validly
- Red X: Price exited OTE zone (stop or target)
- Real-time status monitoring
TRADING SESSIONS:
Displays three major trading sessions with full customization:
Asian Session (Tokyo + Sydney):
- Default: 01:00-13:00 UTC+4
- Typically lower volatility
- Sets up key levels for London open
London Session:
- Default: 11:00-20:00 UTC+4
- Highest liquidity period
- Major institutional moves
New York Session:
- Default: 16:00-01:00 UTC+4
- US market hours
- High impact news events
Features:
- Real-time status indicators (🟢 Open / 🔴 Closed)
- Session high/low tracking
- Overlap detection and highlighting
- Historical session display (0-30 days)
- Customizable colors and borders
───────────────────────────────────────
HOW TO USE
───────────────────────────────────────
MASTER CONTROLS:
Enable/disable major features independently:
- Trading Sessions
- Liquidity Sweeps (Current TF)
- HTF Liquidity Sweeps
- LTF Liquidity Sweeps
- Order Blocks
- Fair Value Gaps
- Inverse Fair Value Gaps
- Optimal Trade Entry Zones
ANTI-REPAINTING SETUP:
For Backtesting/Systematic Trading:
1. Enable "Use Confirmed Signals"
2. Set Confirmation Bars to 2-3
3. All signals will wait for confirmation
4. No repainting will occur
For Real-Time Discretionary Trading:
1. Disable "Use Confirmed Signals"
2. Signals appear immediately
3. Be aware signals may adjust with new bars
MULTI-TIMEFRAME LIQUIDITY STRATEGY:
Top-Down Analysis:
1. Identify HTF liquidity levels (4H/Daily) for major targets
2. Find LTF liquidity levels (1H) for entry refinement
3. Wait for HTF liquidity sweep (liquidity grab)
4. Enter on LTF order block in direction of HTF sweep
5. Target next HTF or LTF liquidity level
Liquidity Sweep Trading:
1. HTF liquidity sweep = major institutional move
2. Look for immediate reversal or continuation
3. Use order blocks for entry timing
4. Place stops beyond the swept liquidity
SESSION-BASED TRADING:
Asian Session Strategy:
1. Identify Asian session high/low
2. Wait for London or NY session to open
3. Trade breakouts of Asian range
4. Target previous day's highs/lows
London/NY Session Strategy:
1. Watch for liquidity sweeps at session open
2. Enter on order block confirmation
3. Use OTE zones for retracement entries
4. Target session high/low or HTF liquidity
OTE ZONE TRADING:
Setup Identification:
1. Wait for clear swing high/low formation
2. Confirm structure break in intended direction
3. Monitor for price retracement to 0.618-0.786 zone
4. Enter when price enters OTE zone with confirmation
Entry Rules:
- Bullish: Long when price enters OTE zone from above
- Bearish: Short when price enters OTE zone from below
- Stop loss: Beyond 0.786 level or swing extreme
- Target: Previous swing high/low or HTF liquidity
Exit Management:
- Indicator tracks when price exits OTE zone
- Red X indicates position should be managed/closed
- Use order blocks or FVGs for partial profit targets
FAIR VALUE GAP STRATEGY:
FVG Entry Method:
1. Wait for FVG formation
2. Monitor for price return to FVG
3. Enter on first touch of FVG zone
4. Stop beyond FVG boundary
5. Target: Fill of FVG or next liquidity level
iFVG Reversal Strategy:
1. Original FVG is filled
2. iFVG forms in opposite direction
3. Indicates failed move or reversal
4. Enter on iFVG confirmation
5. Target: Opposite end of range or next structure
Combined FVG + iFVG:
- When both overlap, indicator combines labels
- Represents high-probability reversal zone
- Use with order blocks for confirmation
ORDER BLOCK STRATEGY:
Entry Approach:
1. Wait for order block formation after structure break
2. Enter on first return to order block
3. Place stop beyond order block boundary
4. Target: Next order block or liquidity level
Confirmation Layers:
- Order block + FVG = strong confluence
- Order block + Liquidity sweep = institutional setup
- Order block + OTE zone = optimal entry
- Order block + Session open = high probability
Volume Analysis:
- Wider colored section = stronger institutional interest
- Use volume bars to confirm order block strength
- Higher volume order blocks = more reliable
───────────────────────────────────────
CONFIGURATION GUIDE
───────────────────────────────────────
LIQUIDITY SETTINGS:
Lookback: 5-30 bars
- Lower = more frequent, sensitive levels
- Higher = fewer, more significant levels
- Recommended: 15 for intraday, 20-25 for swing
Sweep Detection Type:
- Wick Break: Most sensitive
- Close Break: More conservative
- Full Retrace: Stop hunt detection
Sweep Buffer: 0-1.0 ATR
- Adds distance requirement for sweep confirmation
- Prevents false positives
- Recommended: 0.1 for most markets
HTF/LTF LIQUIDITY:
HTF Timeframe Selection:
- Swing trading: 1D or 1W
- Day trading: 4H or 1D
- Scalping: 1H or 4H
LTF Timeframe Selection:
- Swing trading: 4H or 1D
- Day trading: 1H or 4H
- Scalping: 15m or 1H
Strength Filters:
- Min Pivot Strength: Higher = fewer, stronger levels
- Min Distance: Higher = less clustering
- Recommended: 2.0 ATR for HTF, 1.5 ATR for LTF
ORDER BLOCK SETTINGS:
Swing Length: 5-20
- Controls sensitivity of structure break detection
- Lower = more order blocks, faster signals
- Higher = fewer order blocks, stronger signals
- Recommended: 8-10 for most timeframes
Enhancement Filters:
- Min Size: 0.5-1.5 ATR typical
- Volume Multiplier: 1.2-2.0 typical
- Imbalance: Enable for strongest signals only
OTE SETTINGS:
Swing Length: 5-50
- Controls OTE zone formation sensitivity
- Lower = more frequent, smaller moves
- Higher = fewer, larger trend moves
- Recommended: 10-15 for intraday
Require Structure Break:
- Enabled: Only shows OTE after confirmed break
- Disabled: Shows potential OTE zones earlier
- Recommended: Enable for higher probability setups
FVG SETTINGS:
Min FVG Size: 0.1-2.0 ATR
- Lower = more gaps detected
- Higher = only significant gaps
- Recommended: 0.5 ATR for most markets
Fill Threshold: 0.1-1.0
- Determines when gap is considered "filled"
- 0.5 = 50% fill required
- Higher = more conservative
iFVG Min Size: 0.1-2.0 ATR
- Typically smaller than regular FVG
- Recommended: 0.3 ATR
ALERT SYSTEM:
Available Alerts:
- Liquidity Sweeps (Current TF)
- HTF Liquidity Sweeps
- LTF Liquidity Sweeps
- Session Changes (Open/Close)
- OTE Entry Signals
Alert Setup:
1. Enable alerts in settings
2. Select specific alert types
3. Create TradingView alert using "Any alert() function call"
4. Configure delivery method (mobile, email, webhook)
Alert Messages Include:
- Event type and direction
- Confirmation status (if using confirmed mode)
- Price level
- Timeframe (for liquidity sweeps)
───────────────────────────────────────
RECOMMENDED CONFIGURATIONS
───────────────────────────────────────
For Day Trading (15m-1H charts):
- HTF Liquidity: 4H
- LTF Liquidity: 1H
- Liquidity Lookback: 15
- Order Block Swing Length: 8
- OTE Swing Length: 10
- Confirmed Signals: Enabled, 2 bars
For Swing Trading (4H-1D charts):
- HTF Liquidity: 1D or 1W
- LTF Liquidity: 4H
- Liquidity Lookback: 20
- Order Block Swing Length: 10
- OTE Swing Length: 15
- Confirmed Signals: Enabled, 2-3 bars
For Scalping (5m-15m charts):
- HTF Liquidity: 1H or 4H
- LTF Liquidity: 15m or 1H
- Liquidity Lookback: 10-12
- Order Block Swing Length: 6-8
- OTE Swing Length: 8
- Confirmed Signals: Optional
───────────────────────────────────────
PERFORMANCE OPTIMIZATION
───────────────────────────────────────
This indicator is optimized with:
- max_bars_back declarations for efficient lookback
- Automatic memory cleanup every 10 bars
- Conditional execution based on enabled features
- Drawing object limits to prevent performance degradation
Memory Management:
- Old liquidity zones automatically removed
- Filled FVGs/iFVGs cleaned up
- Exited OTE zones removed
- Mitigated order blocks deleted
Best Practices:
- Enable only needed features
- Use appropriate timeframe combinations
- Don't display excessive historical sessions
- Monitor drawing object counts on lower timeframes
───────────────────────────────────────
EDUCATIONAL DISCLAIMER
───────────────────────────────────────
This indicator combines multiple institutional trading concepts:
- Liquidity theory (where orders accumulate)
- Order flow analysis (institutional footprints)
- Price imbalance detection (FVGs)
- Fibonacci retracement theory (OTE zones)
- Session-based trading (time-of-day patterns)
All calculations use standard technical analysis methods:
- Pivot high/low detection
- ATR-based normalization
- Volume analysis
- Fibonacci ratios
- Time-based filtering
The indicator identifies potential setups but does not predict future price movements. Success depends on proper application within a complete trading plan including risk management, position sizing, and market context analysis.
───────────────────────────────────────
USAGE DISCLAIMER
───────────────────────────────────────
This tool is for educational and analytical purposes. Trading involves substantial risk of loss. The anti-repainting features provide confirmed signals but do not guarantee profitability. Always conduct independent analysis, use proper risk management, and never risk capital you cannot afford to lose. Past performance does not indicate future results.
